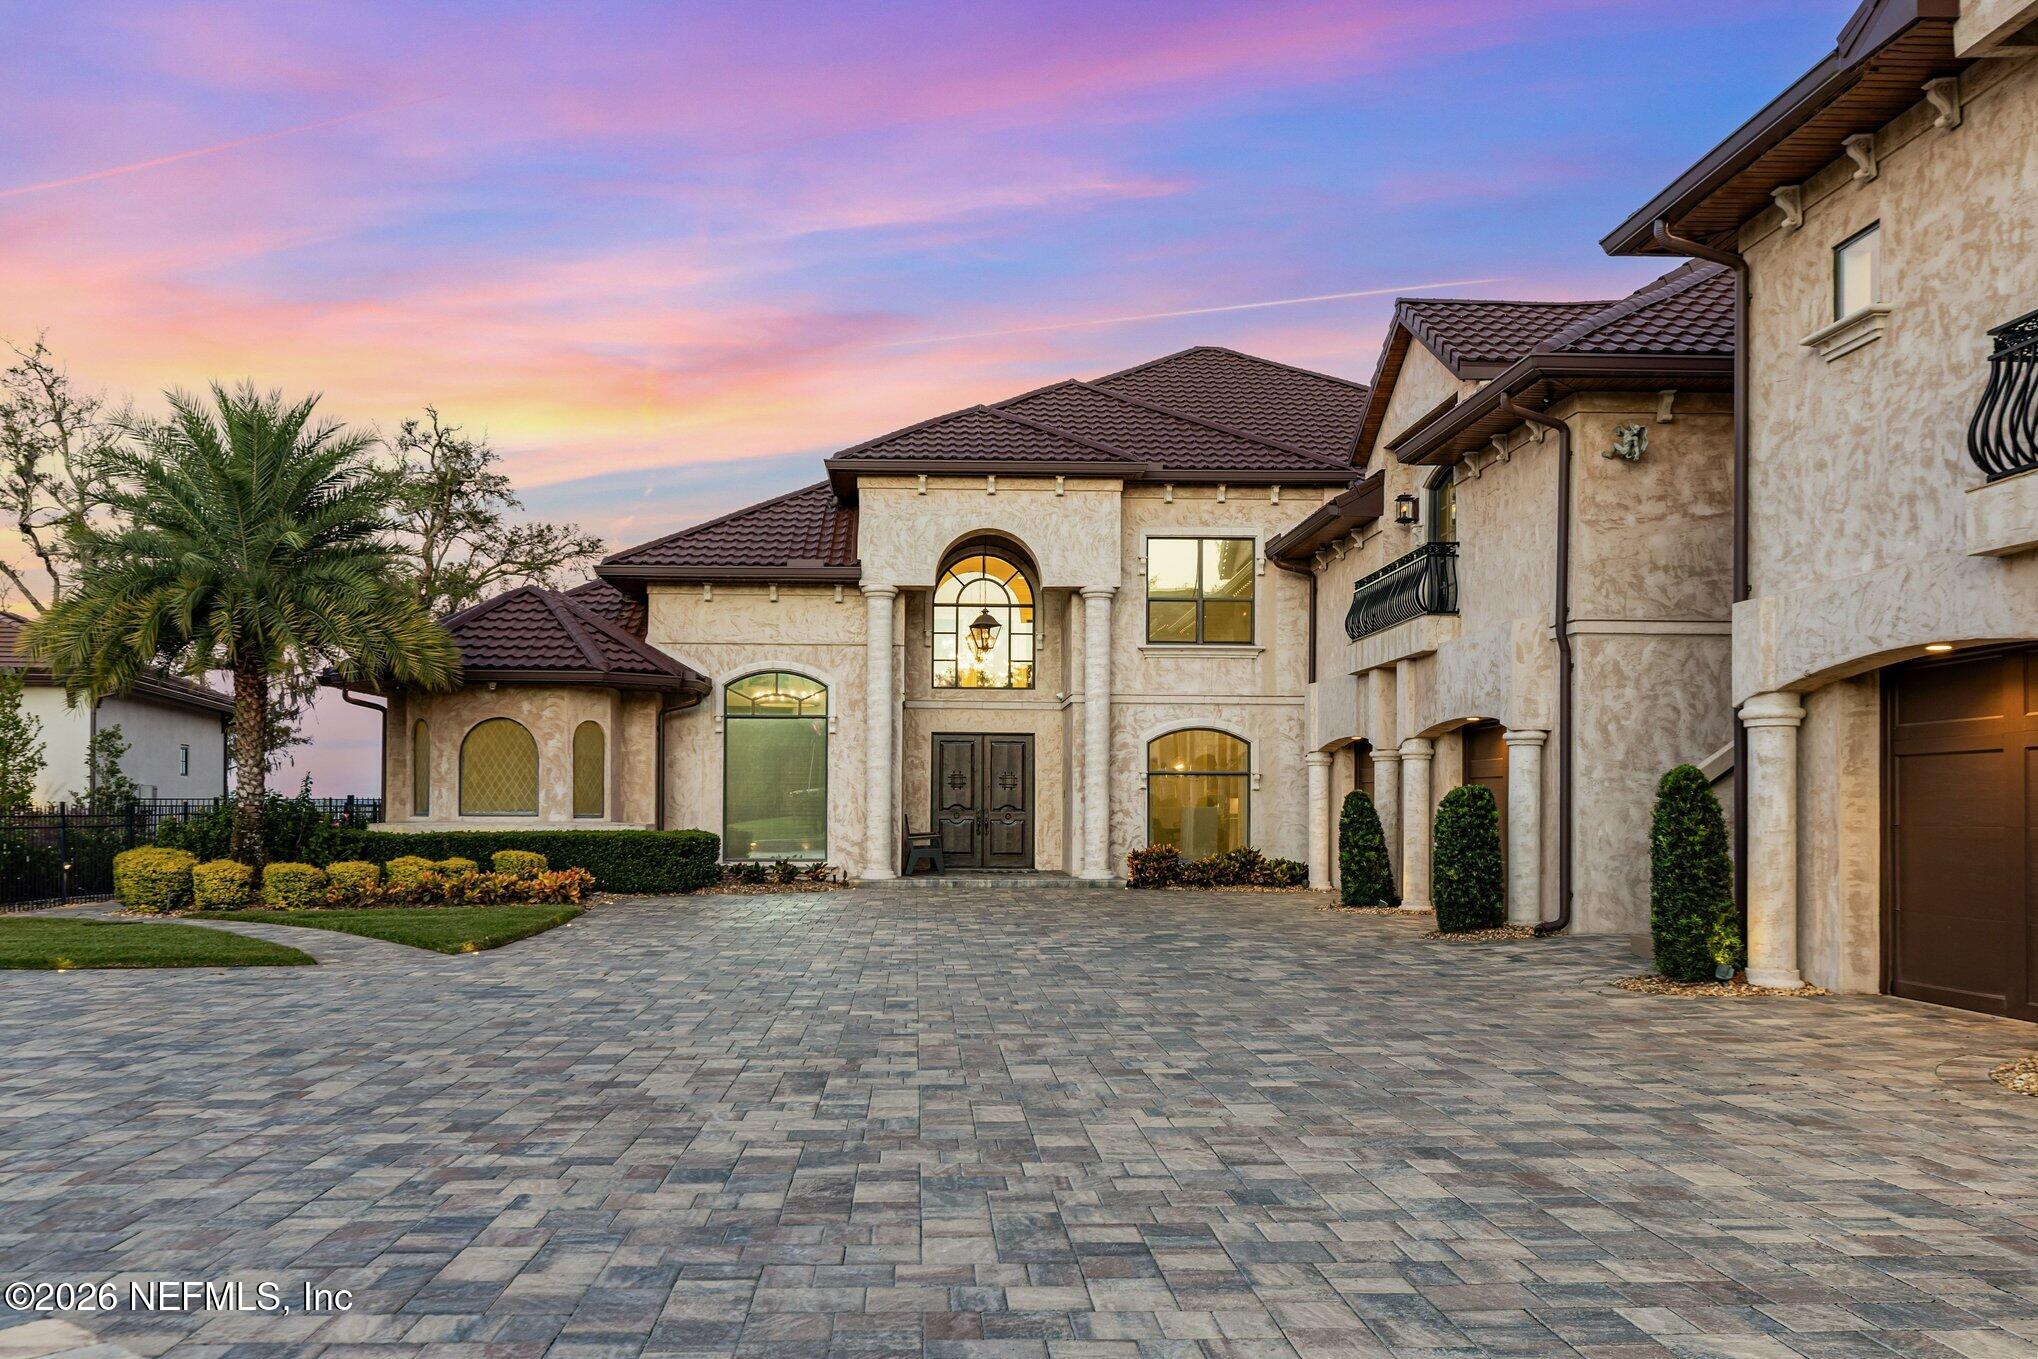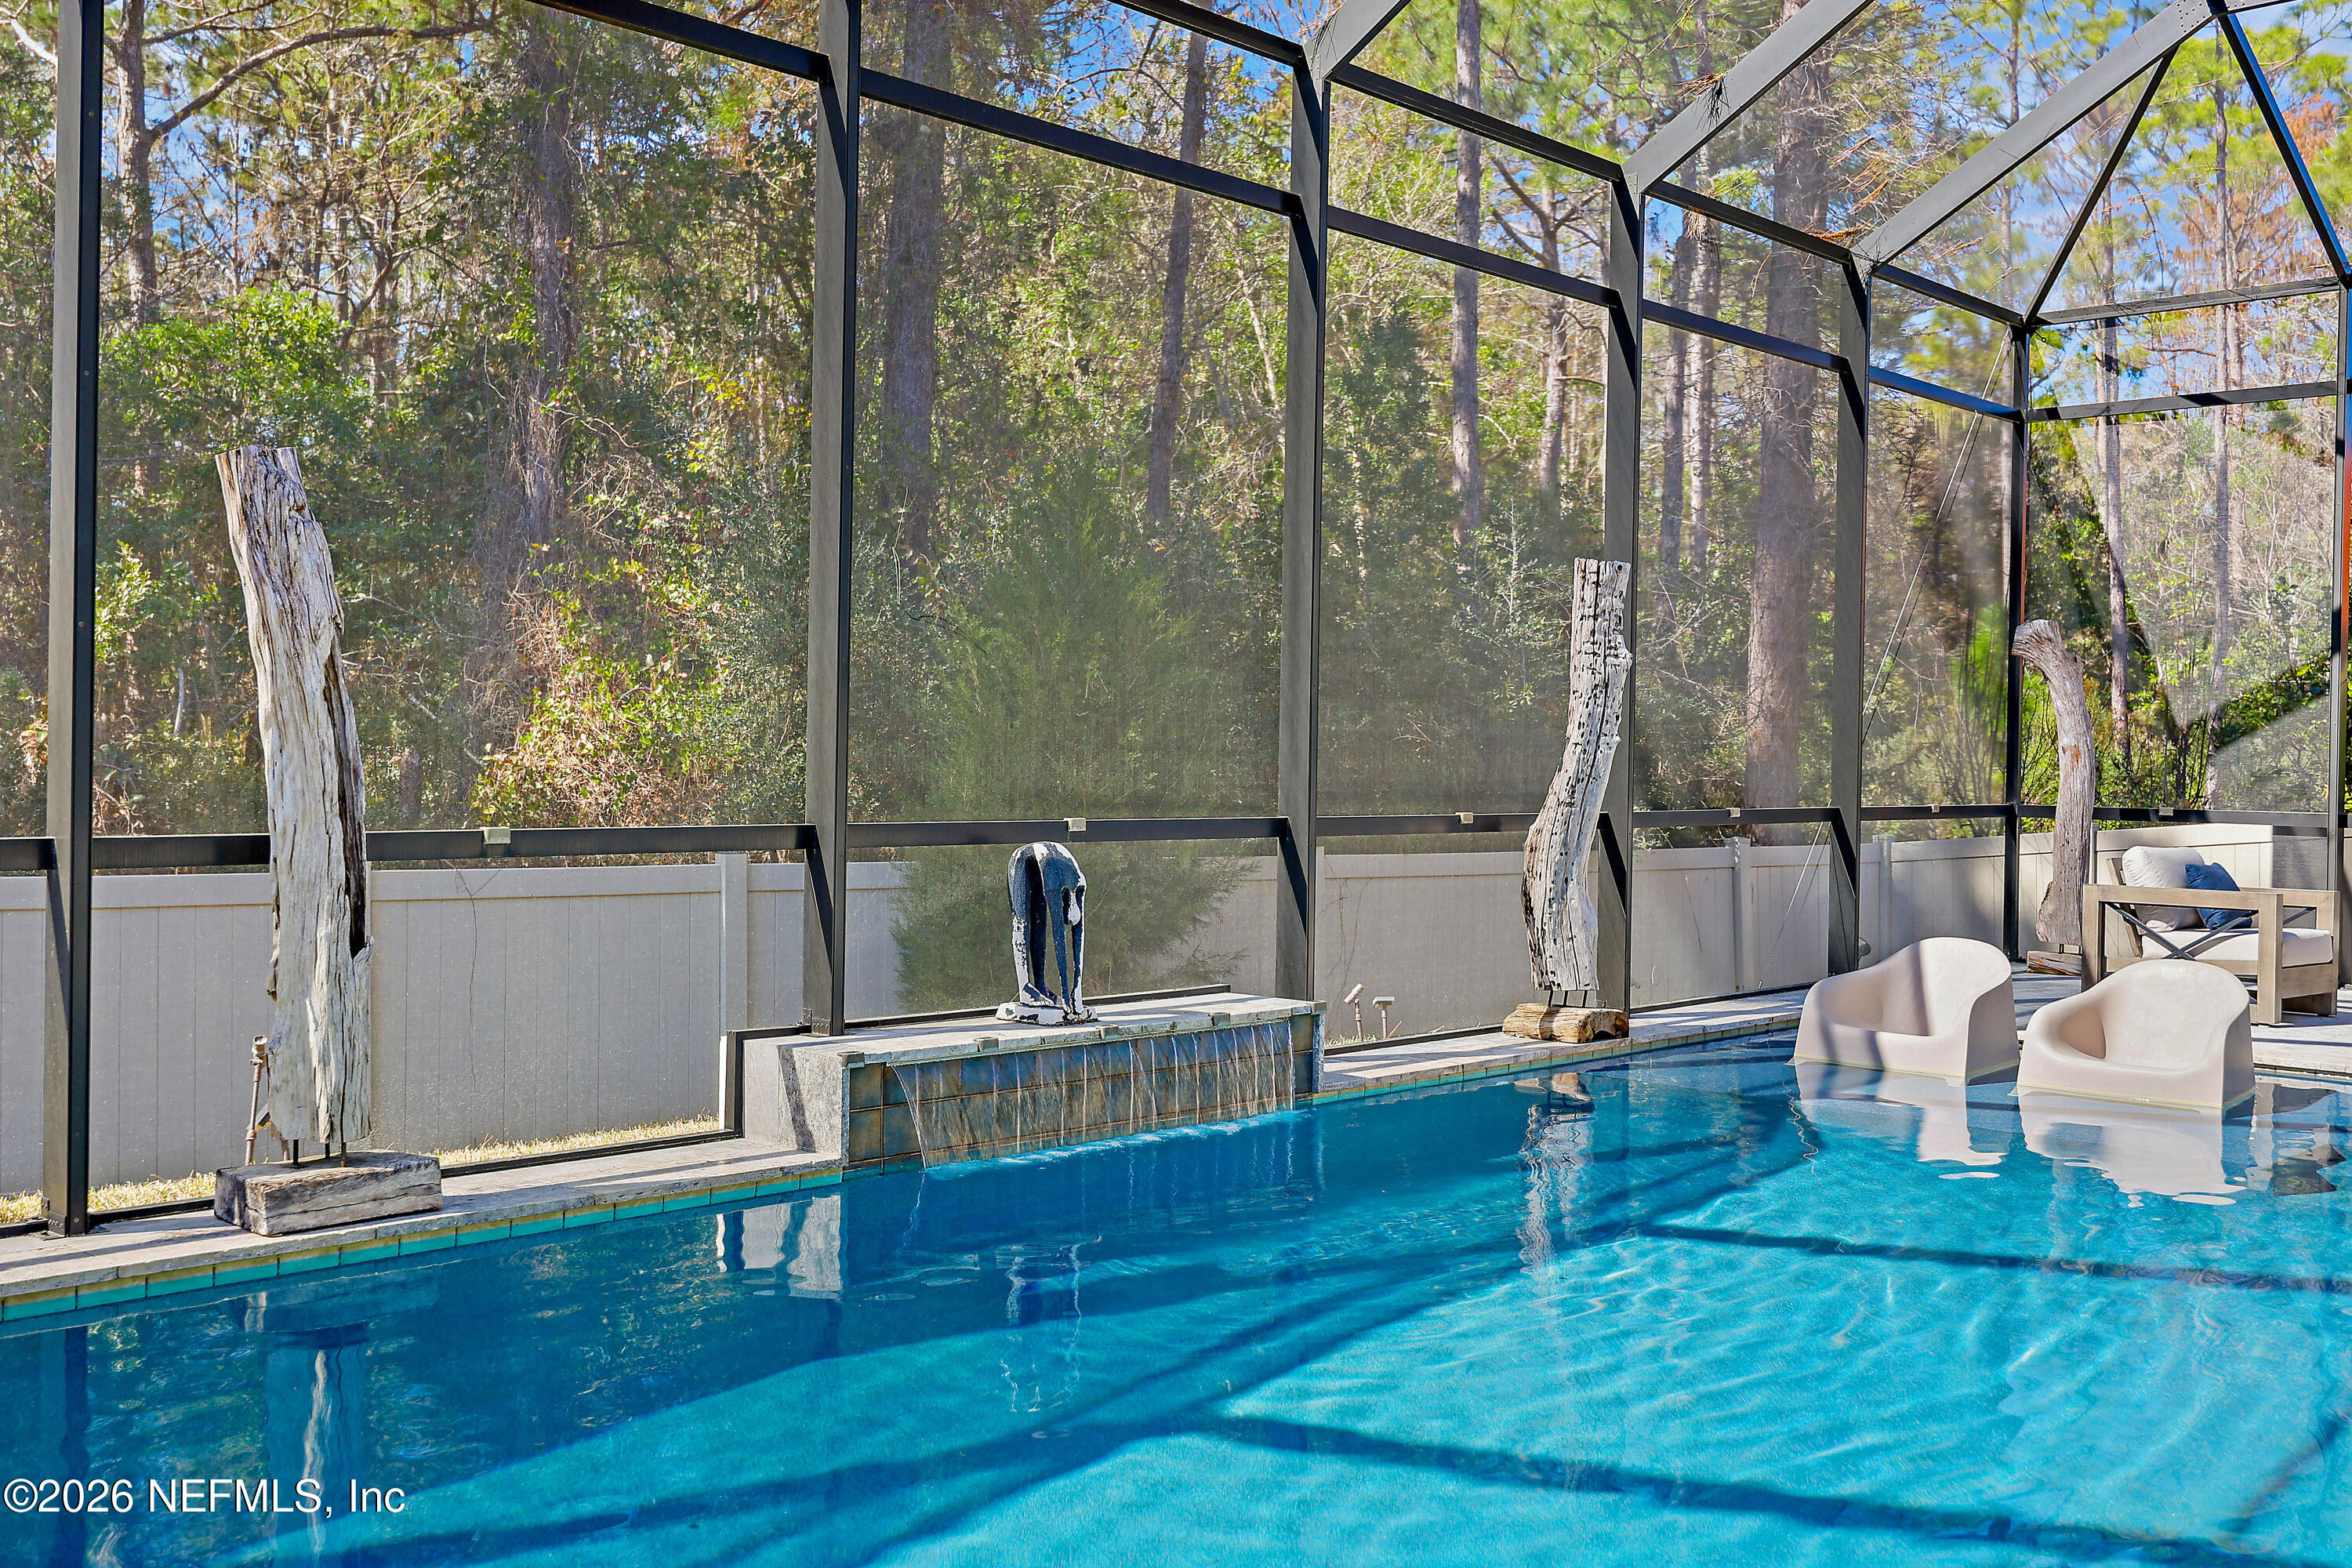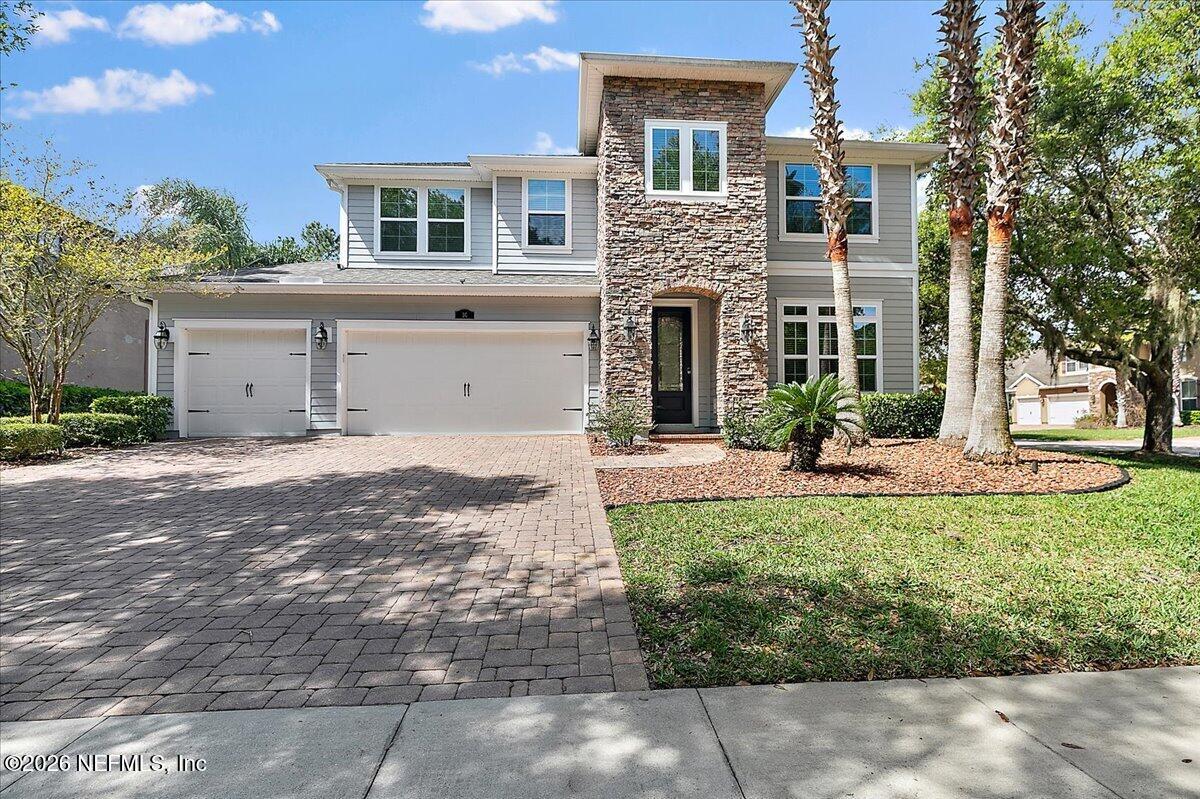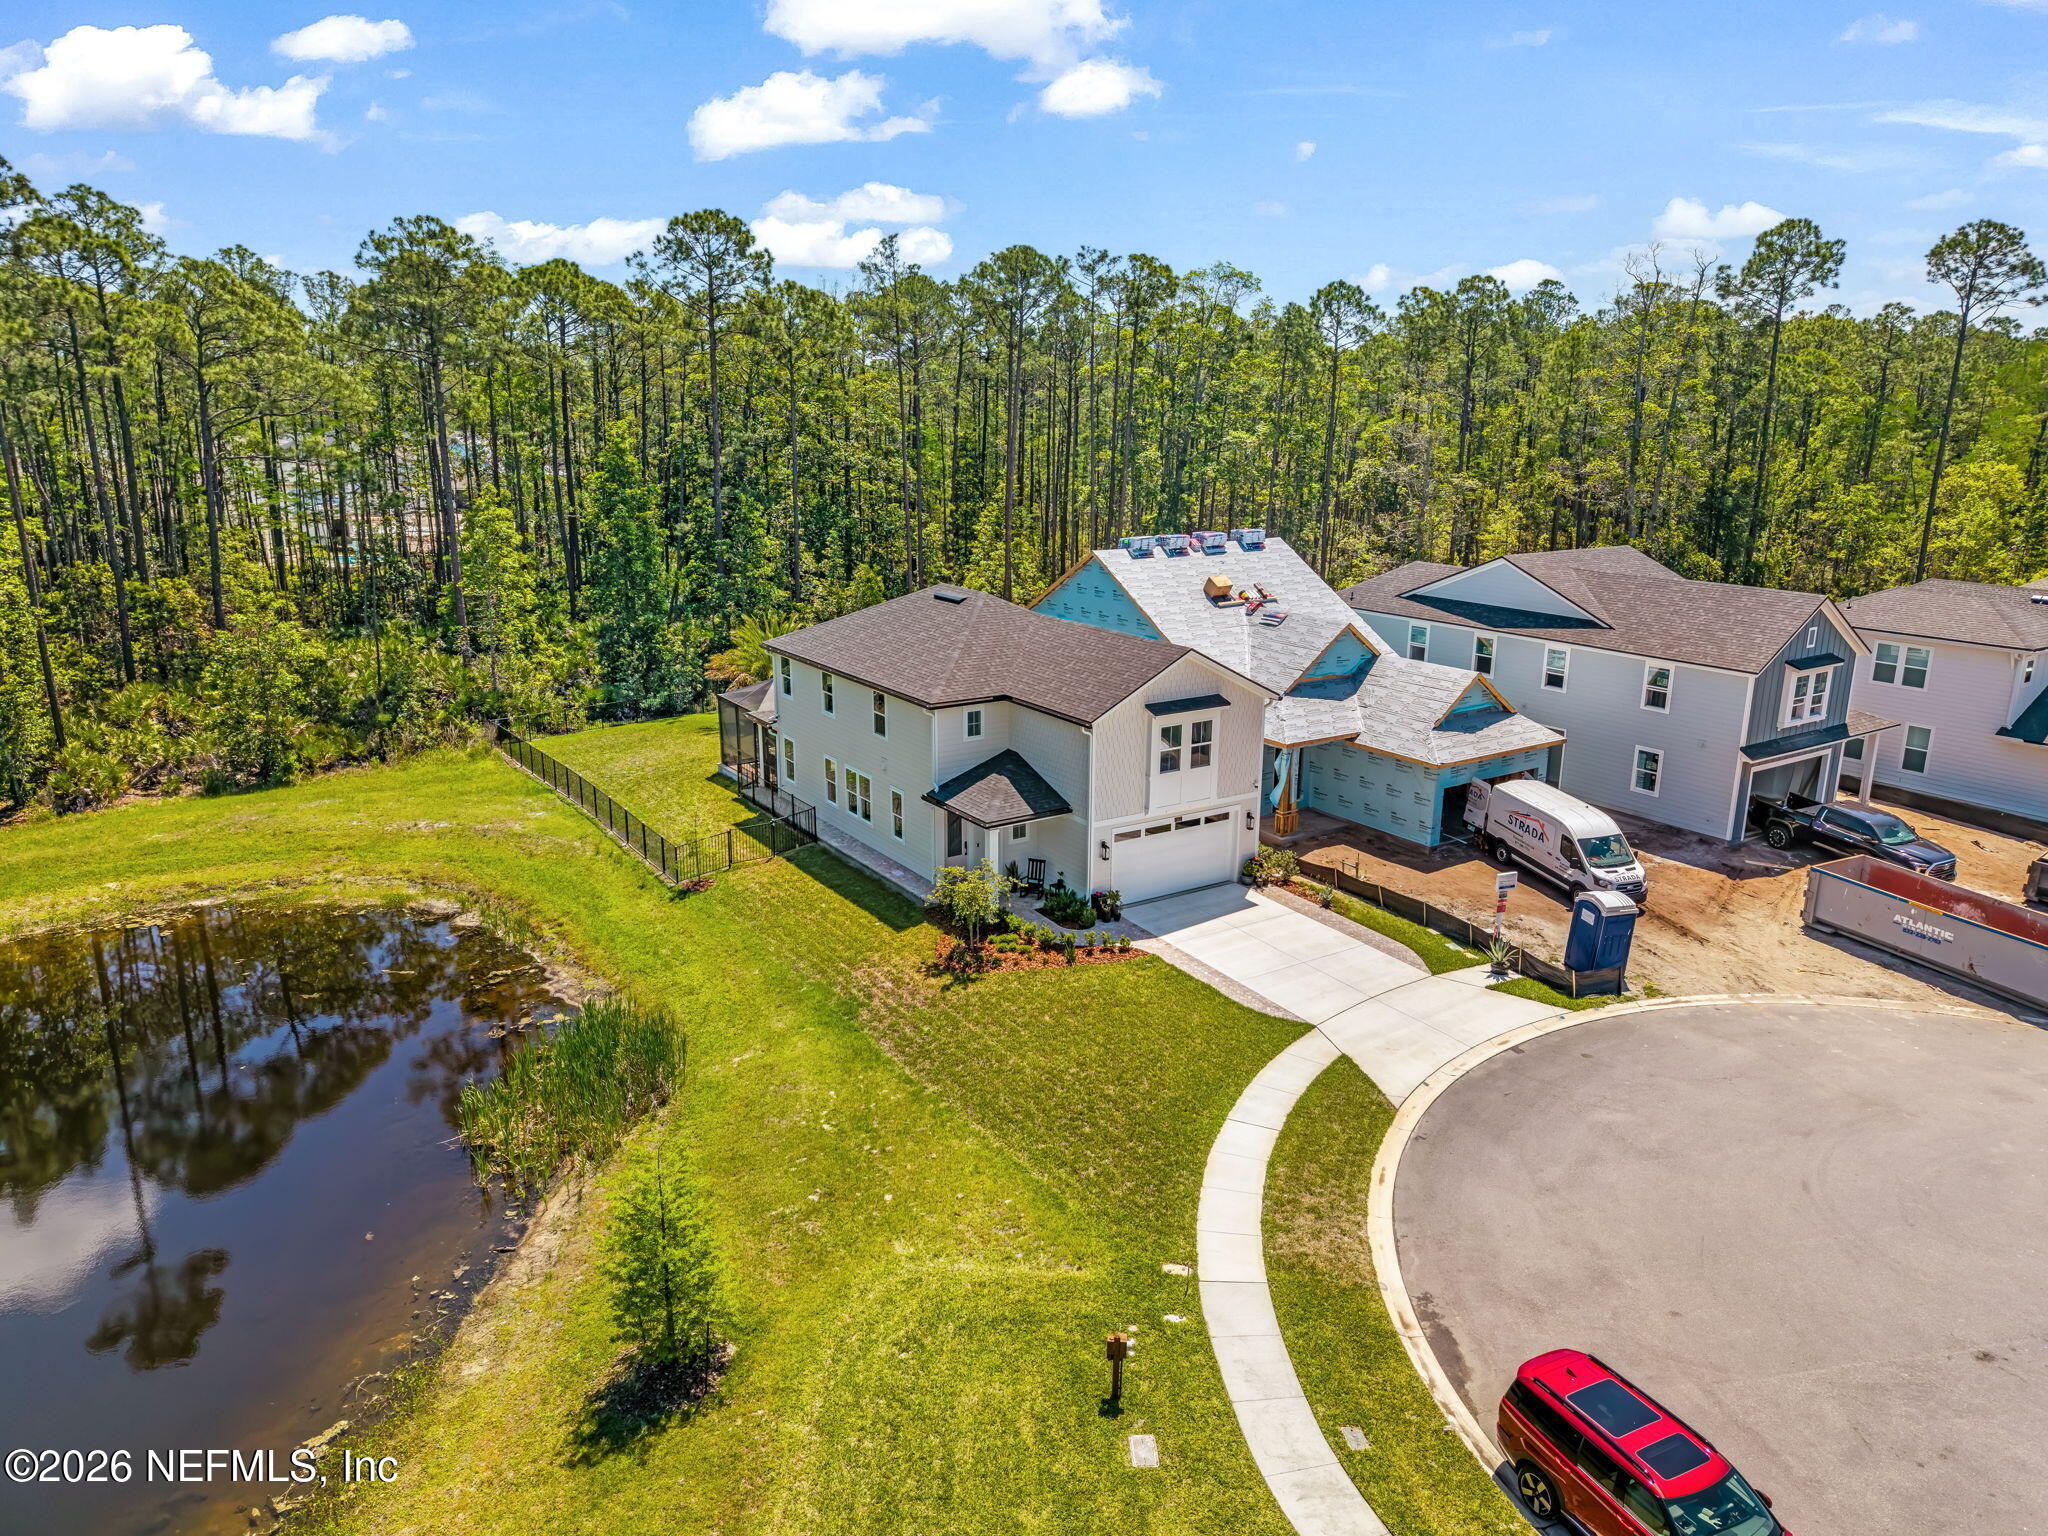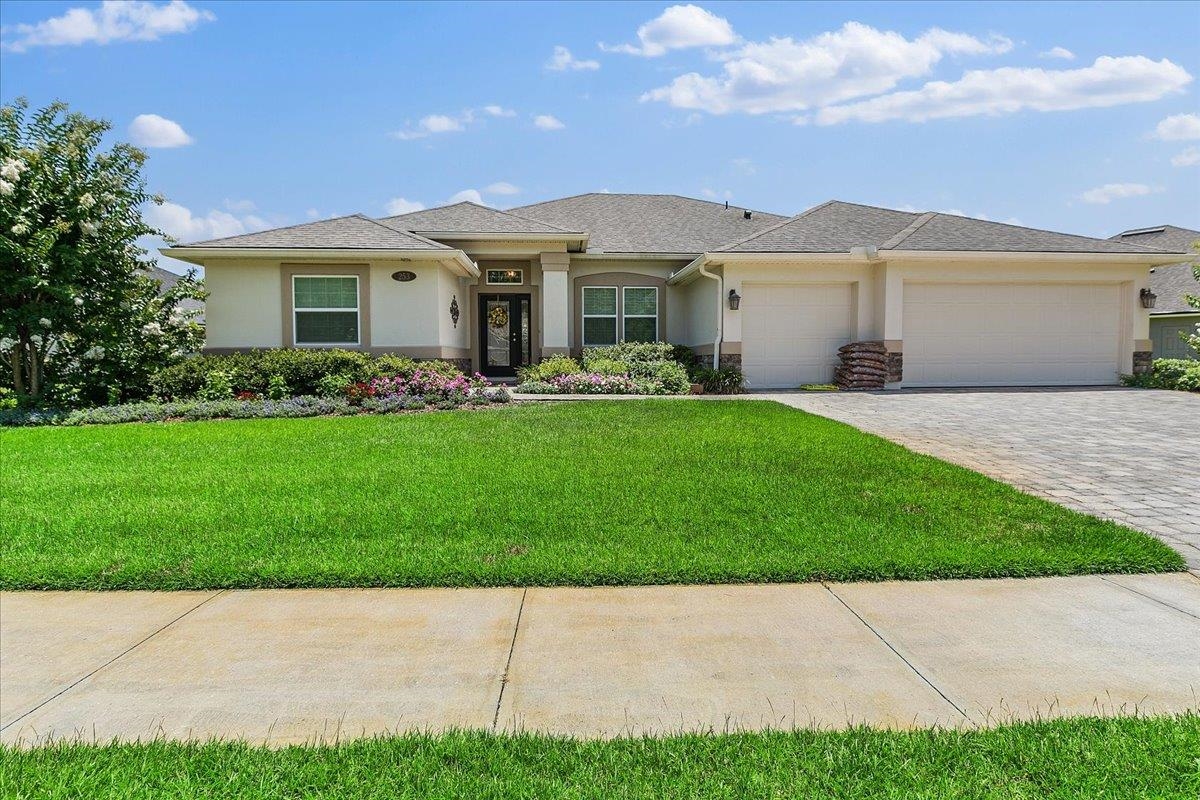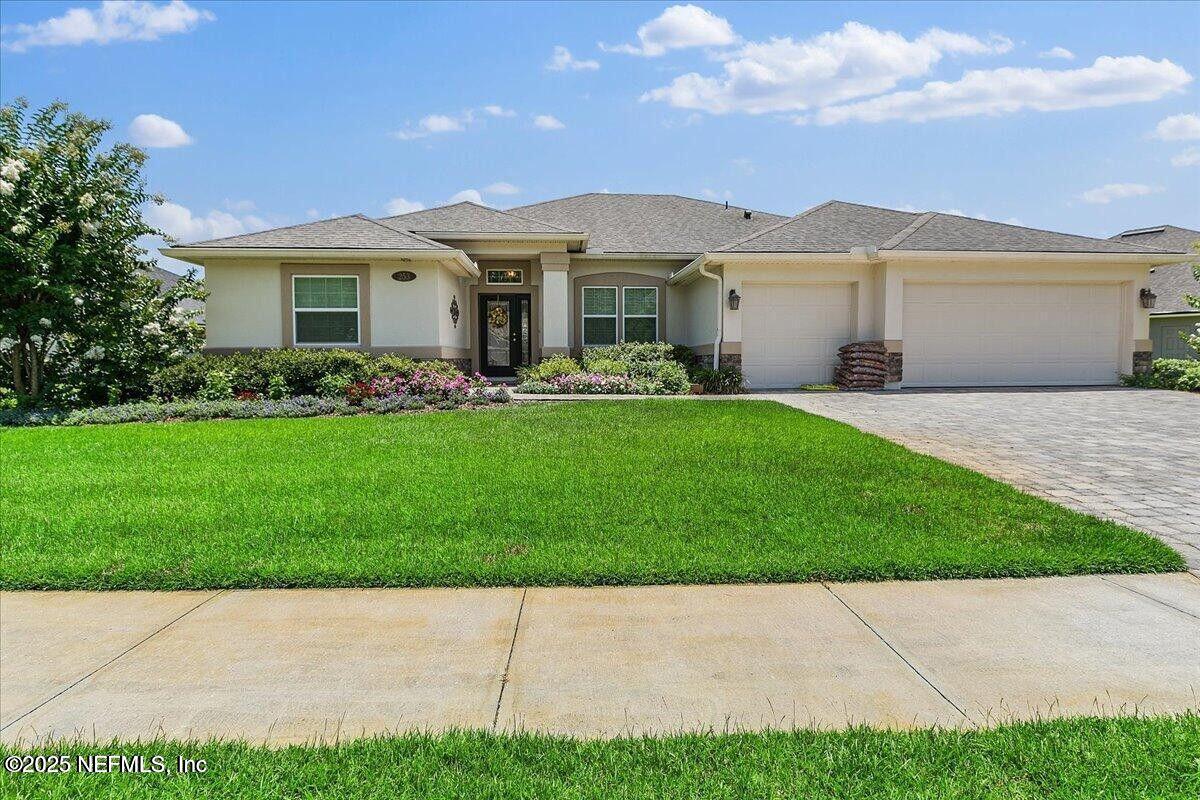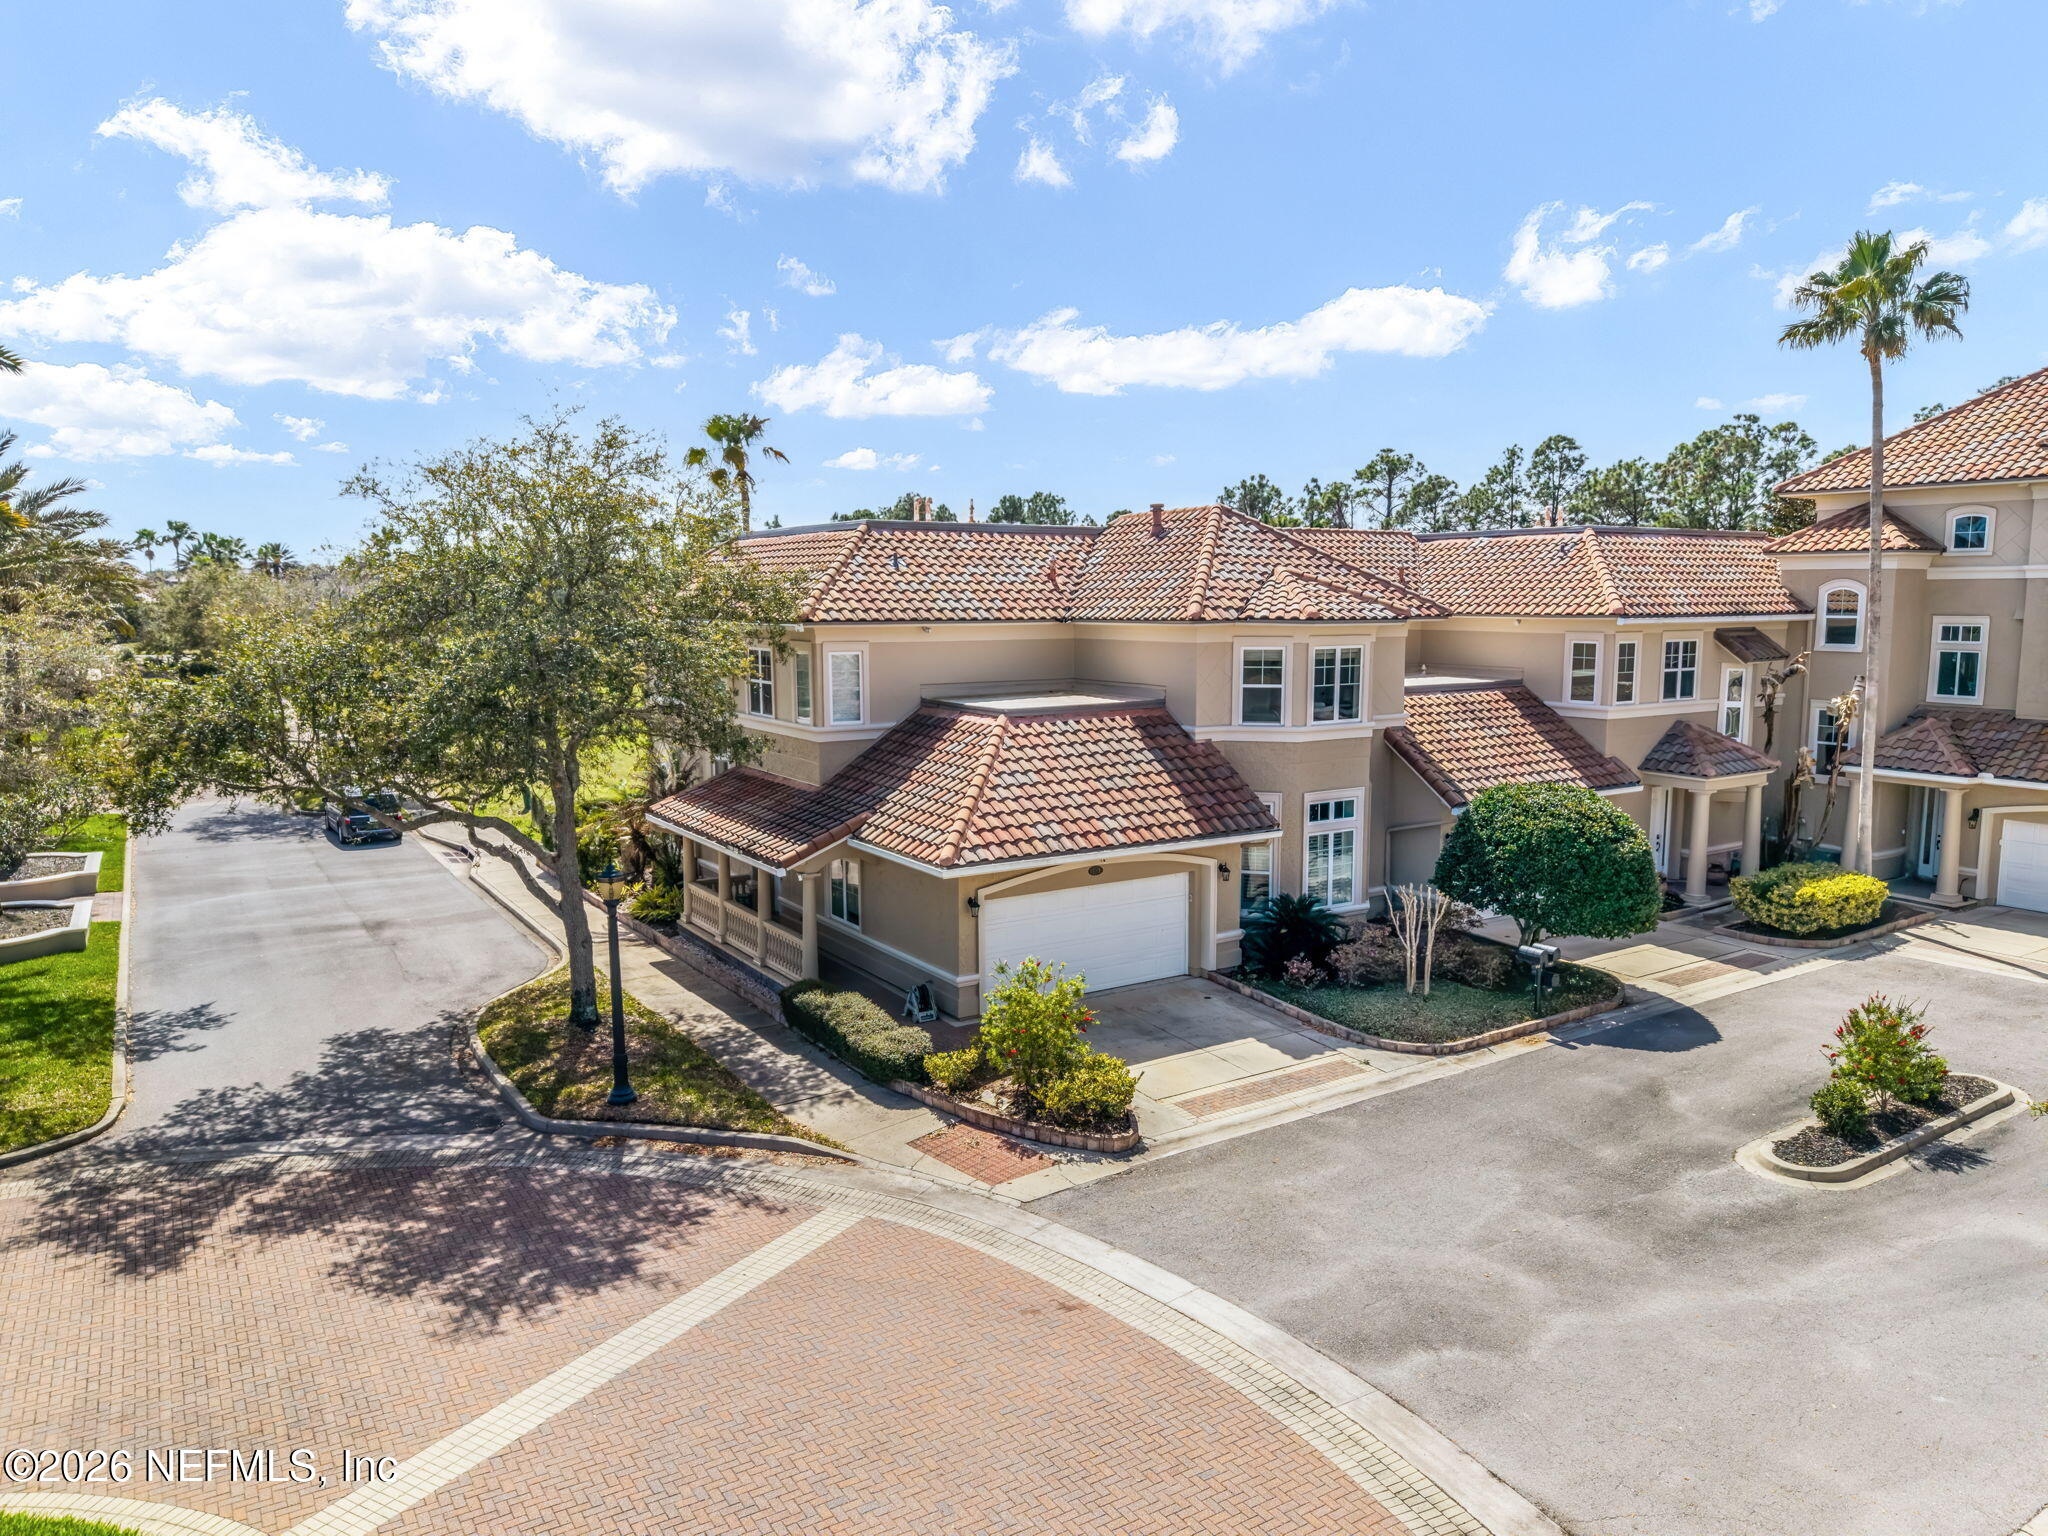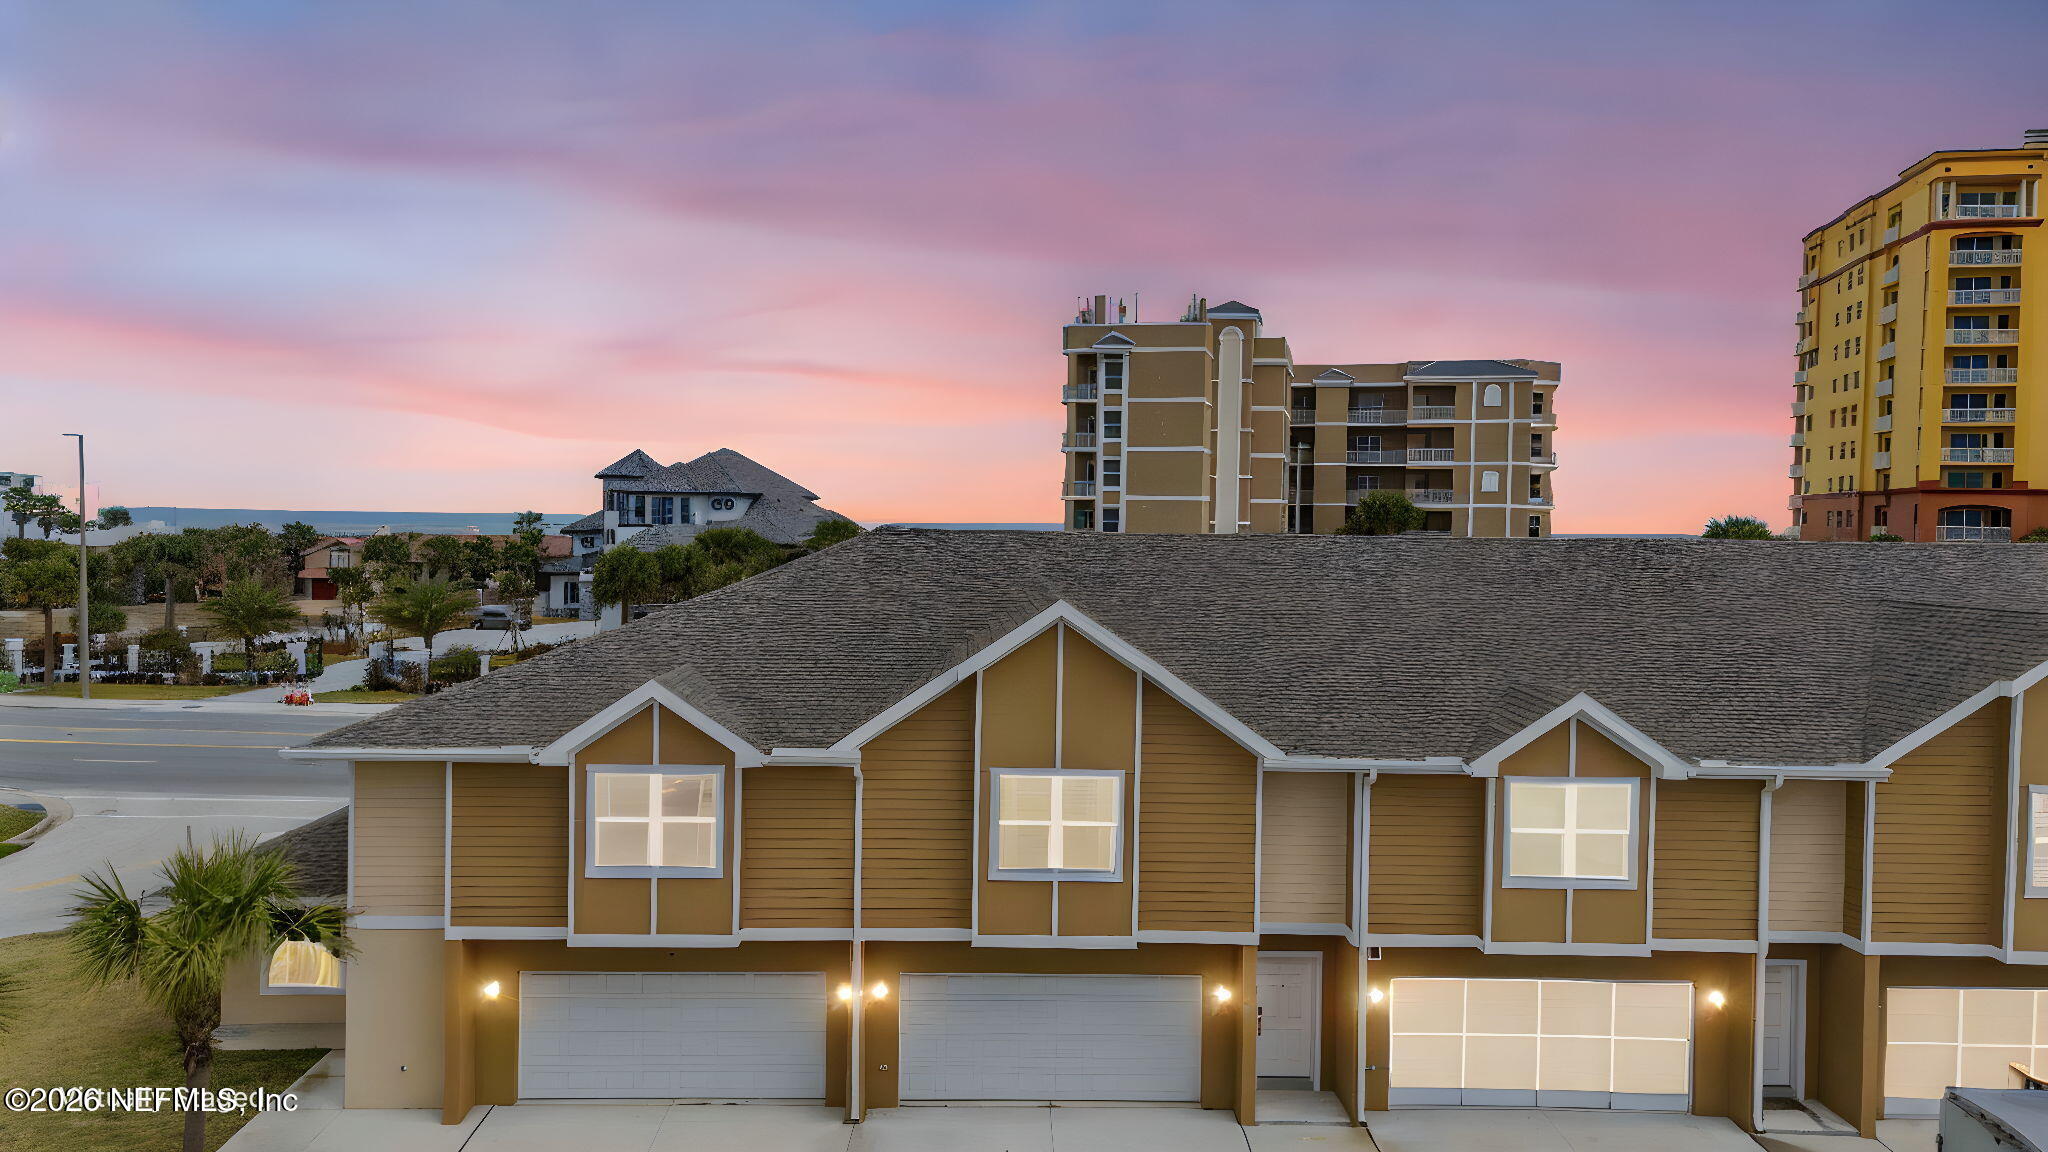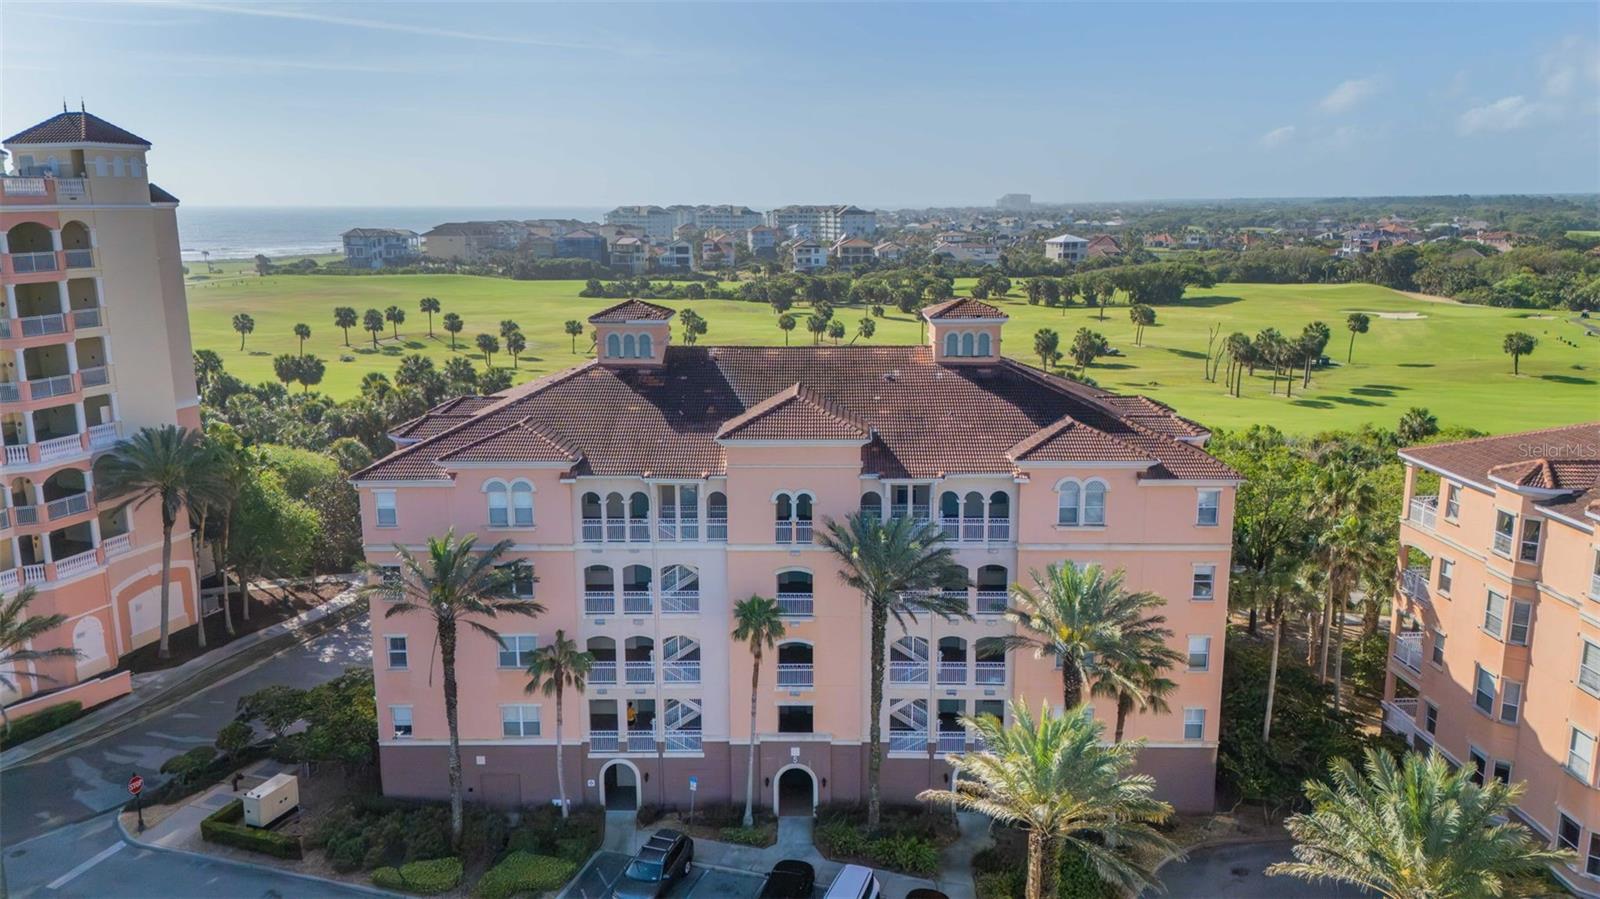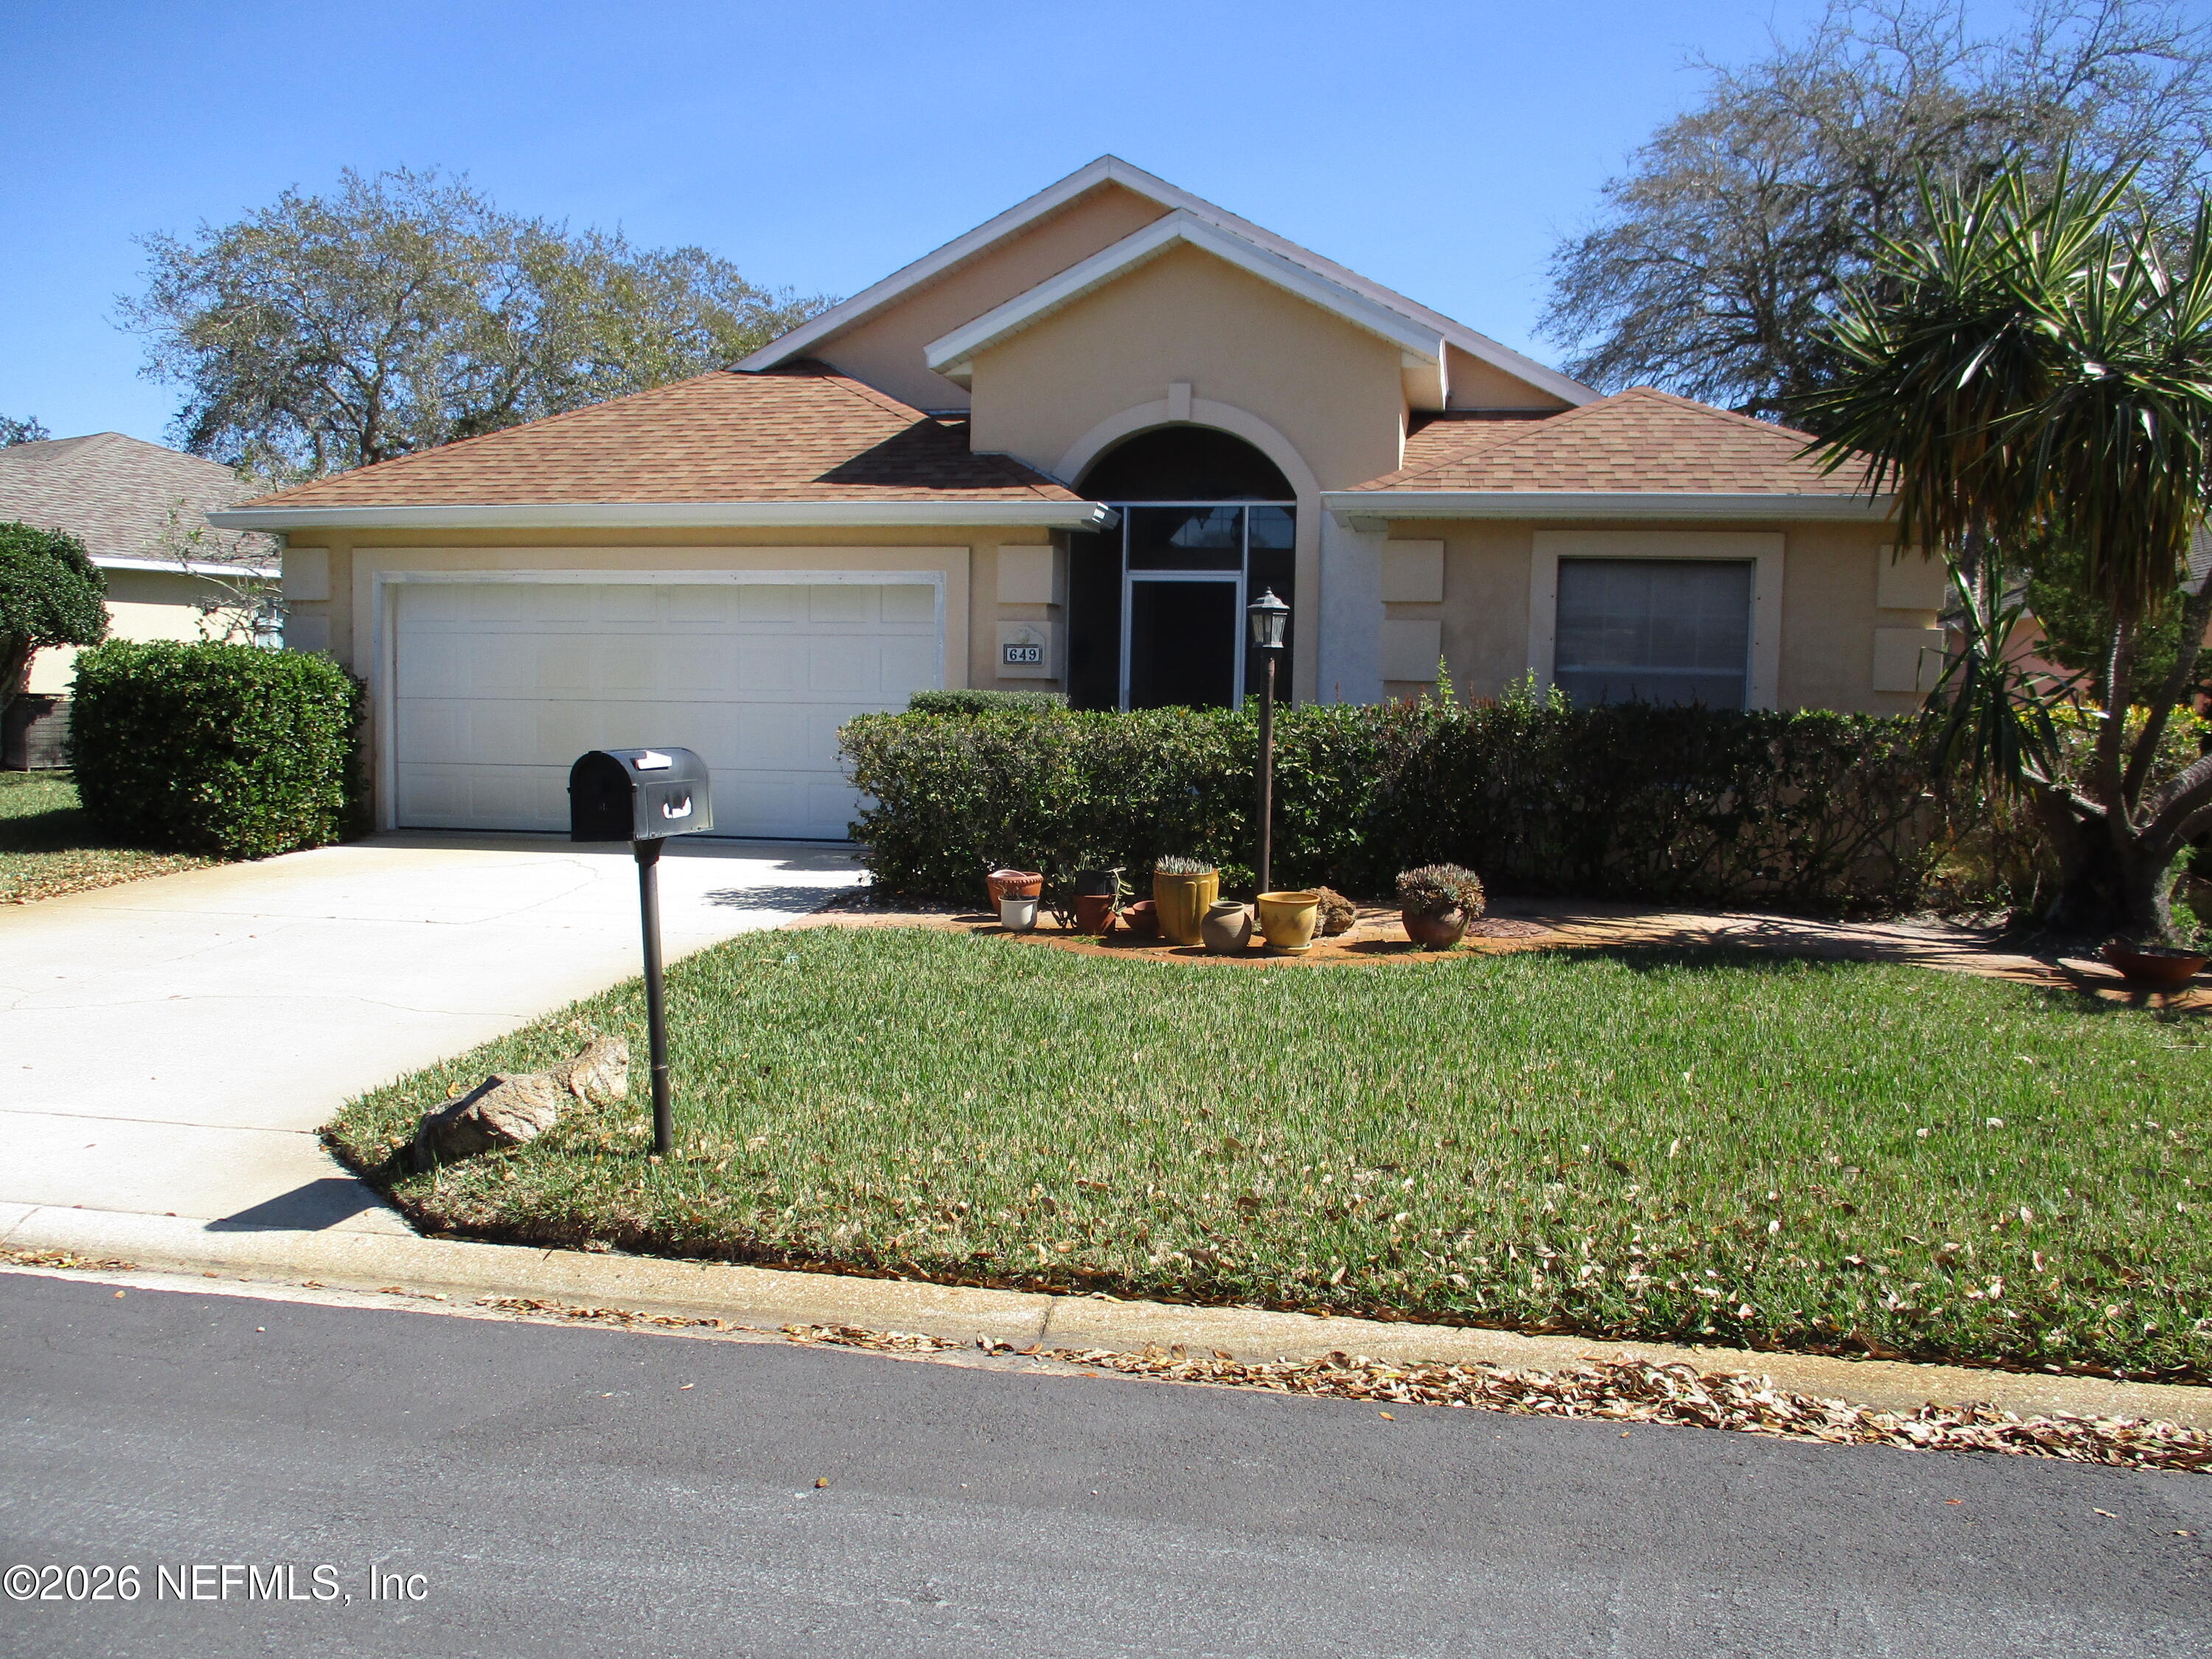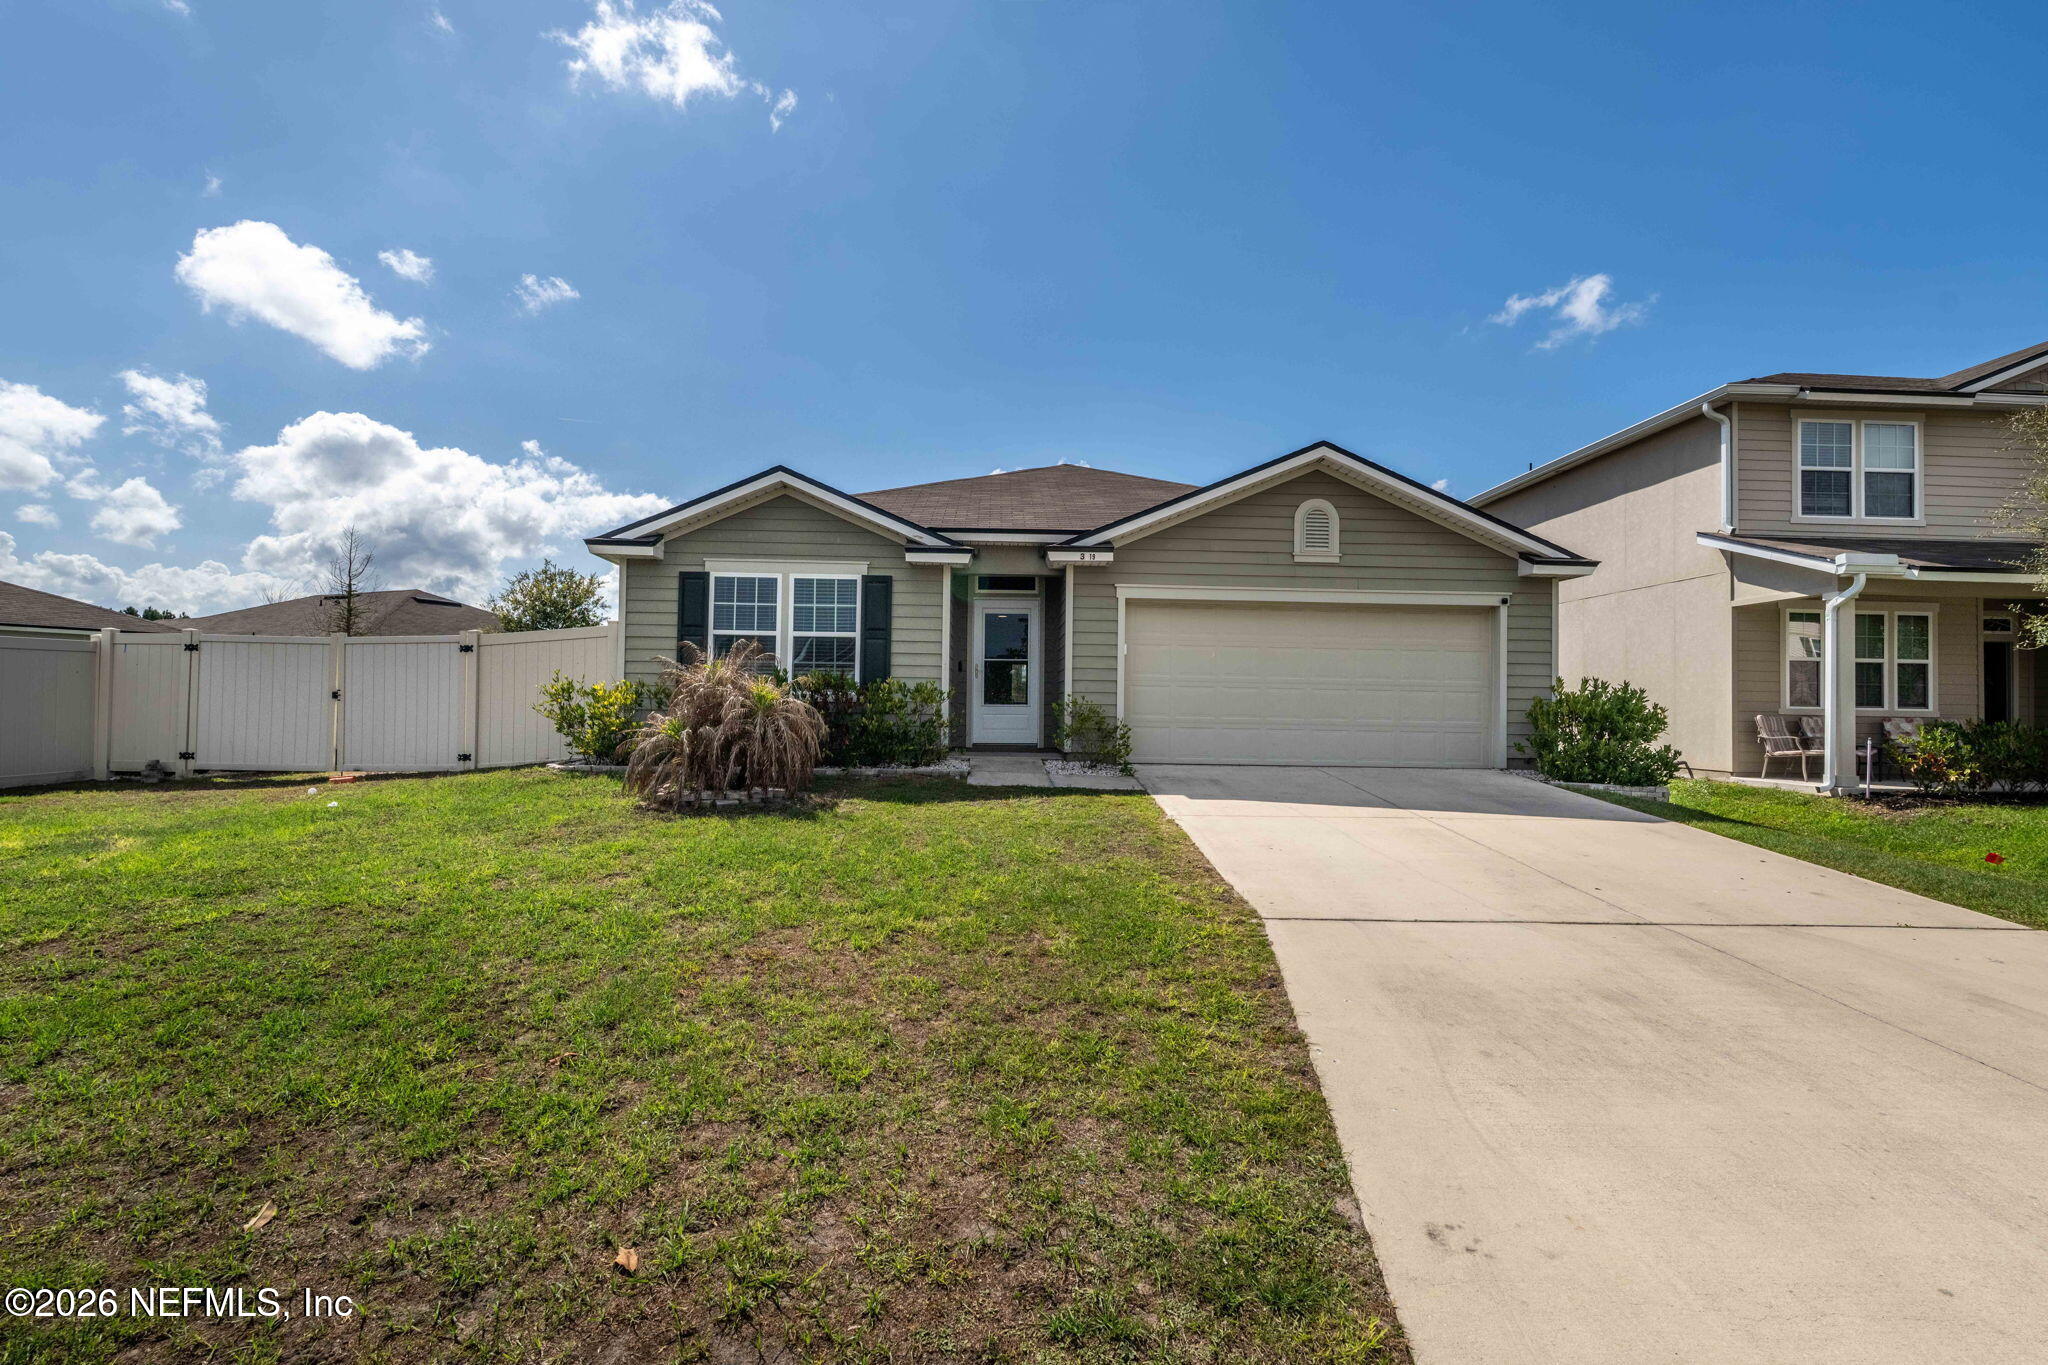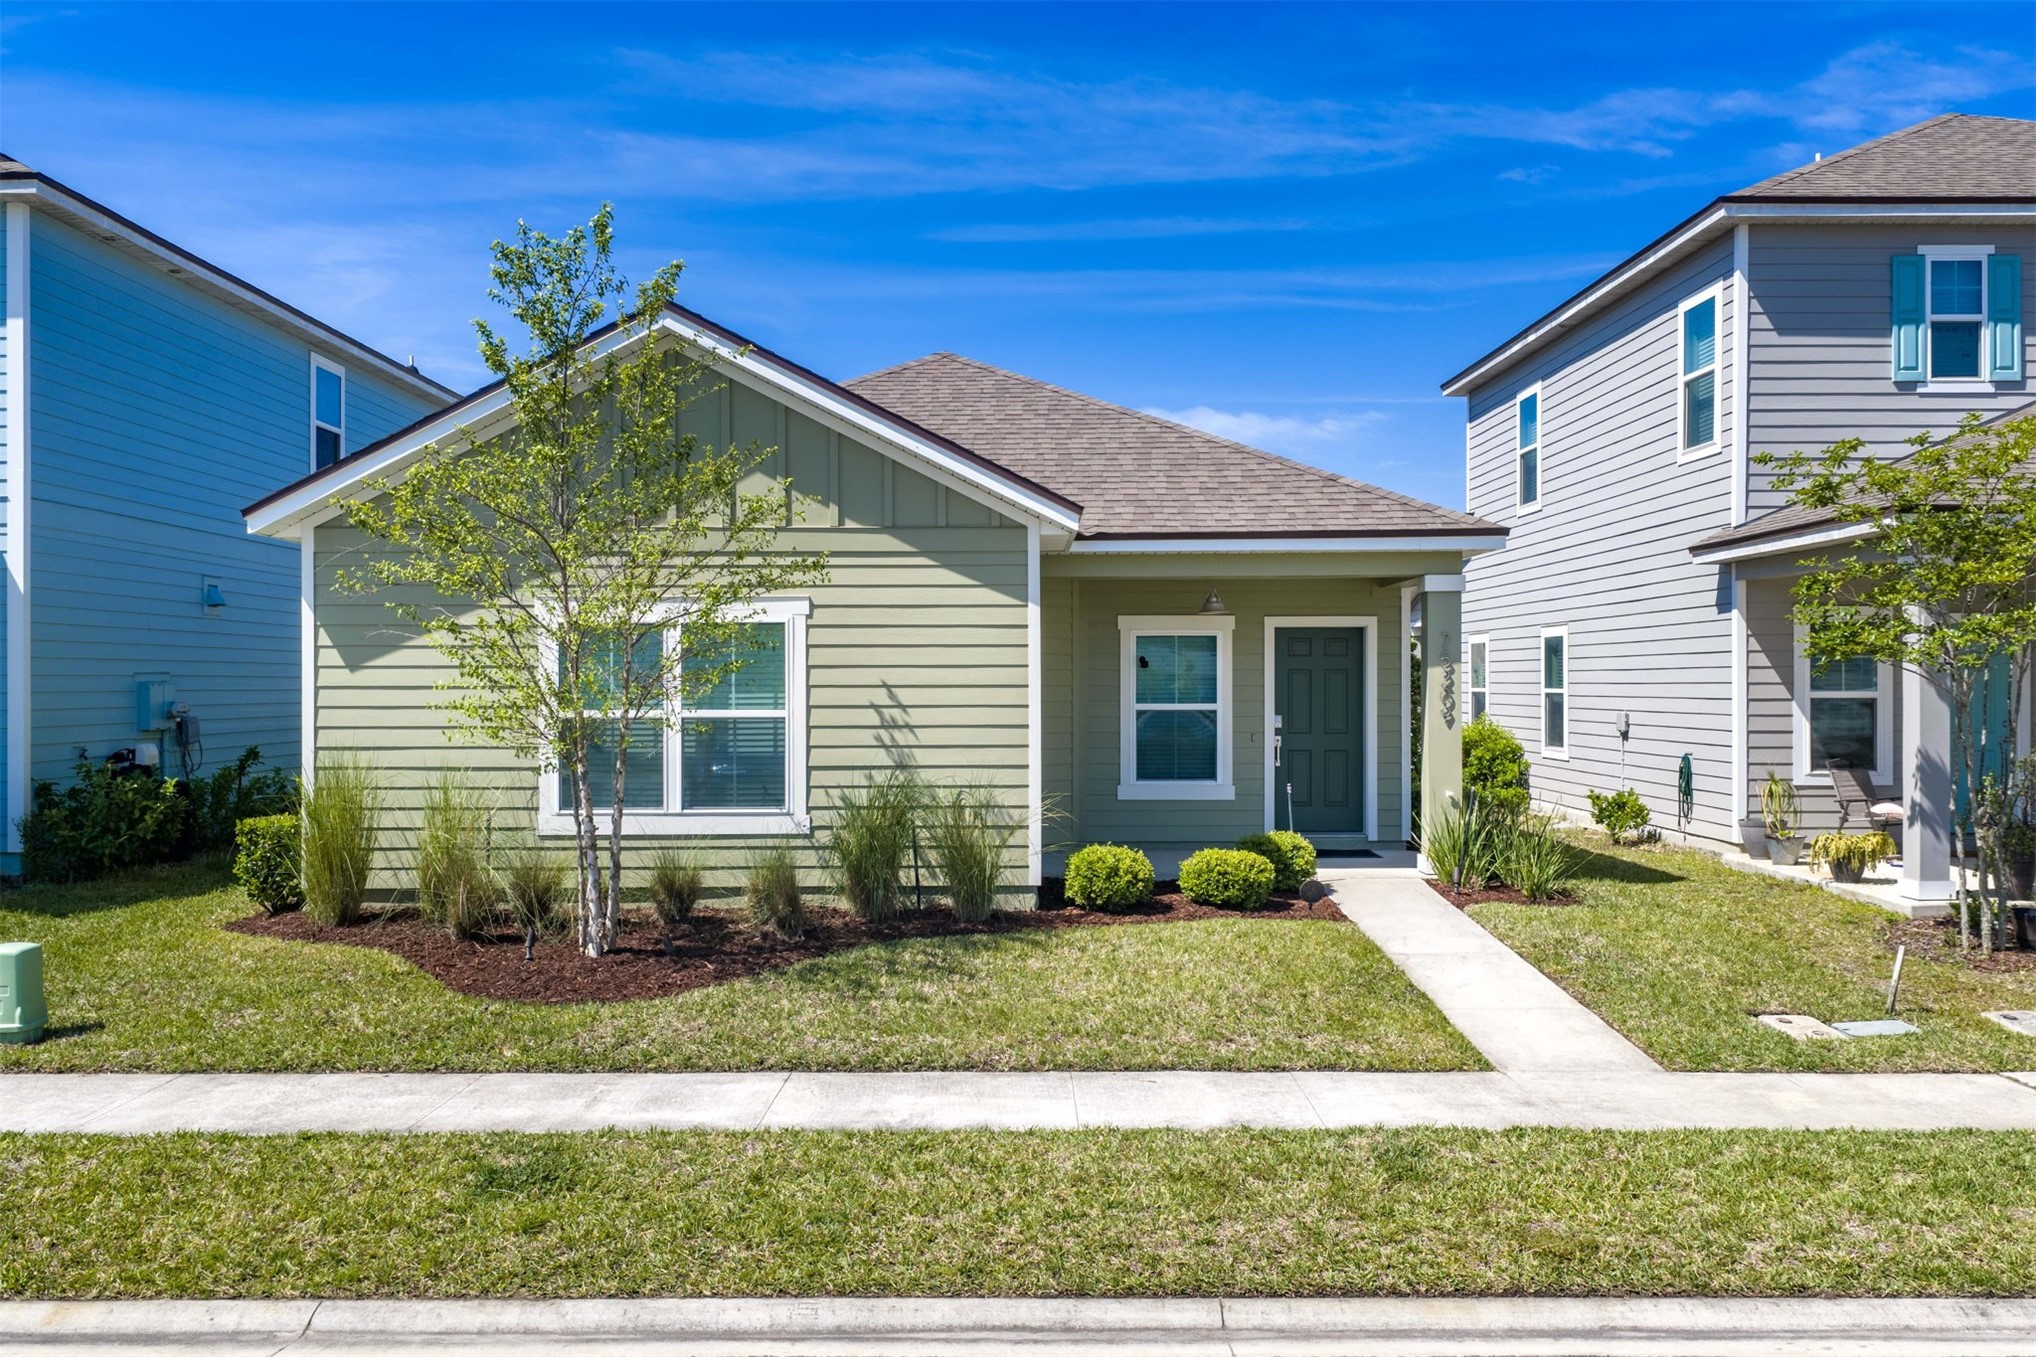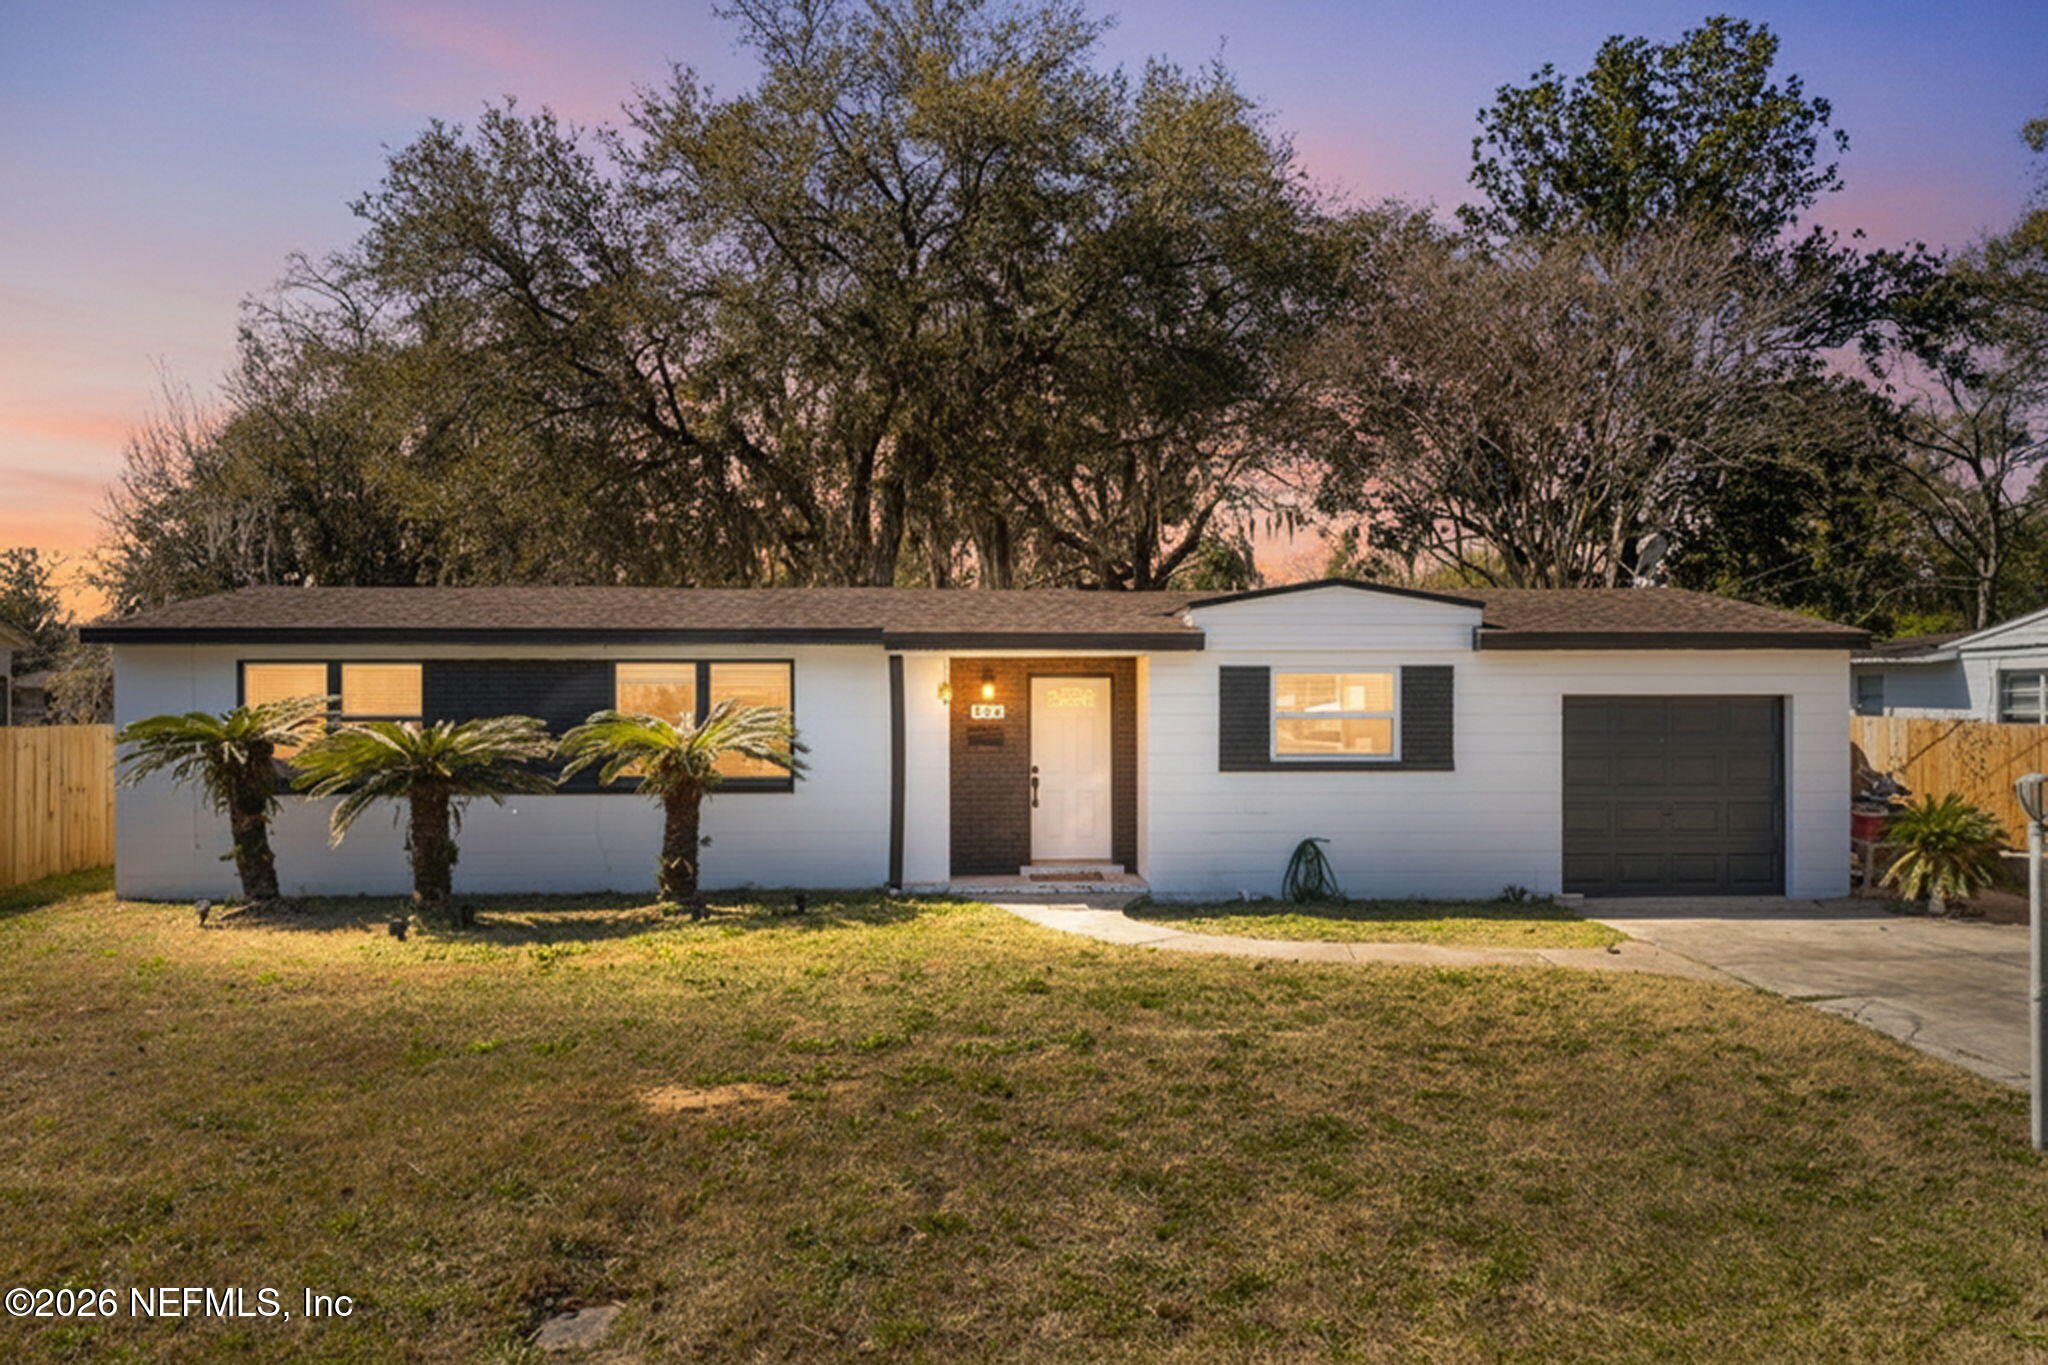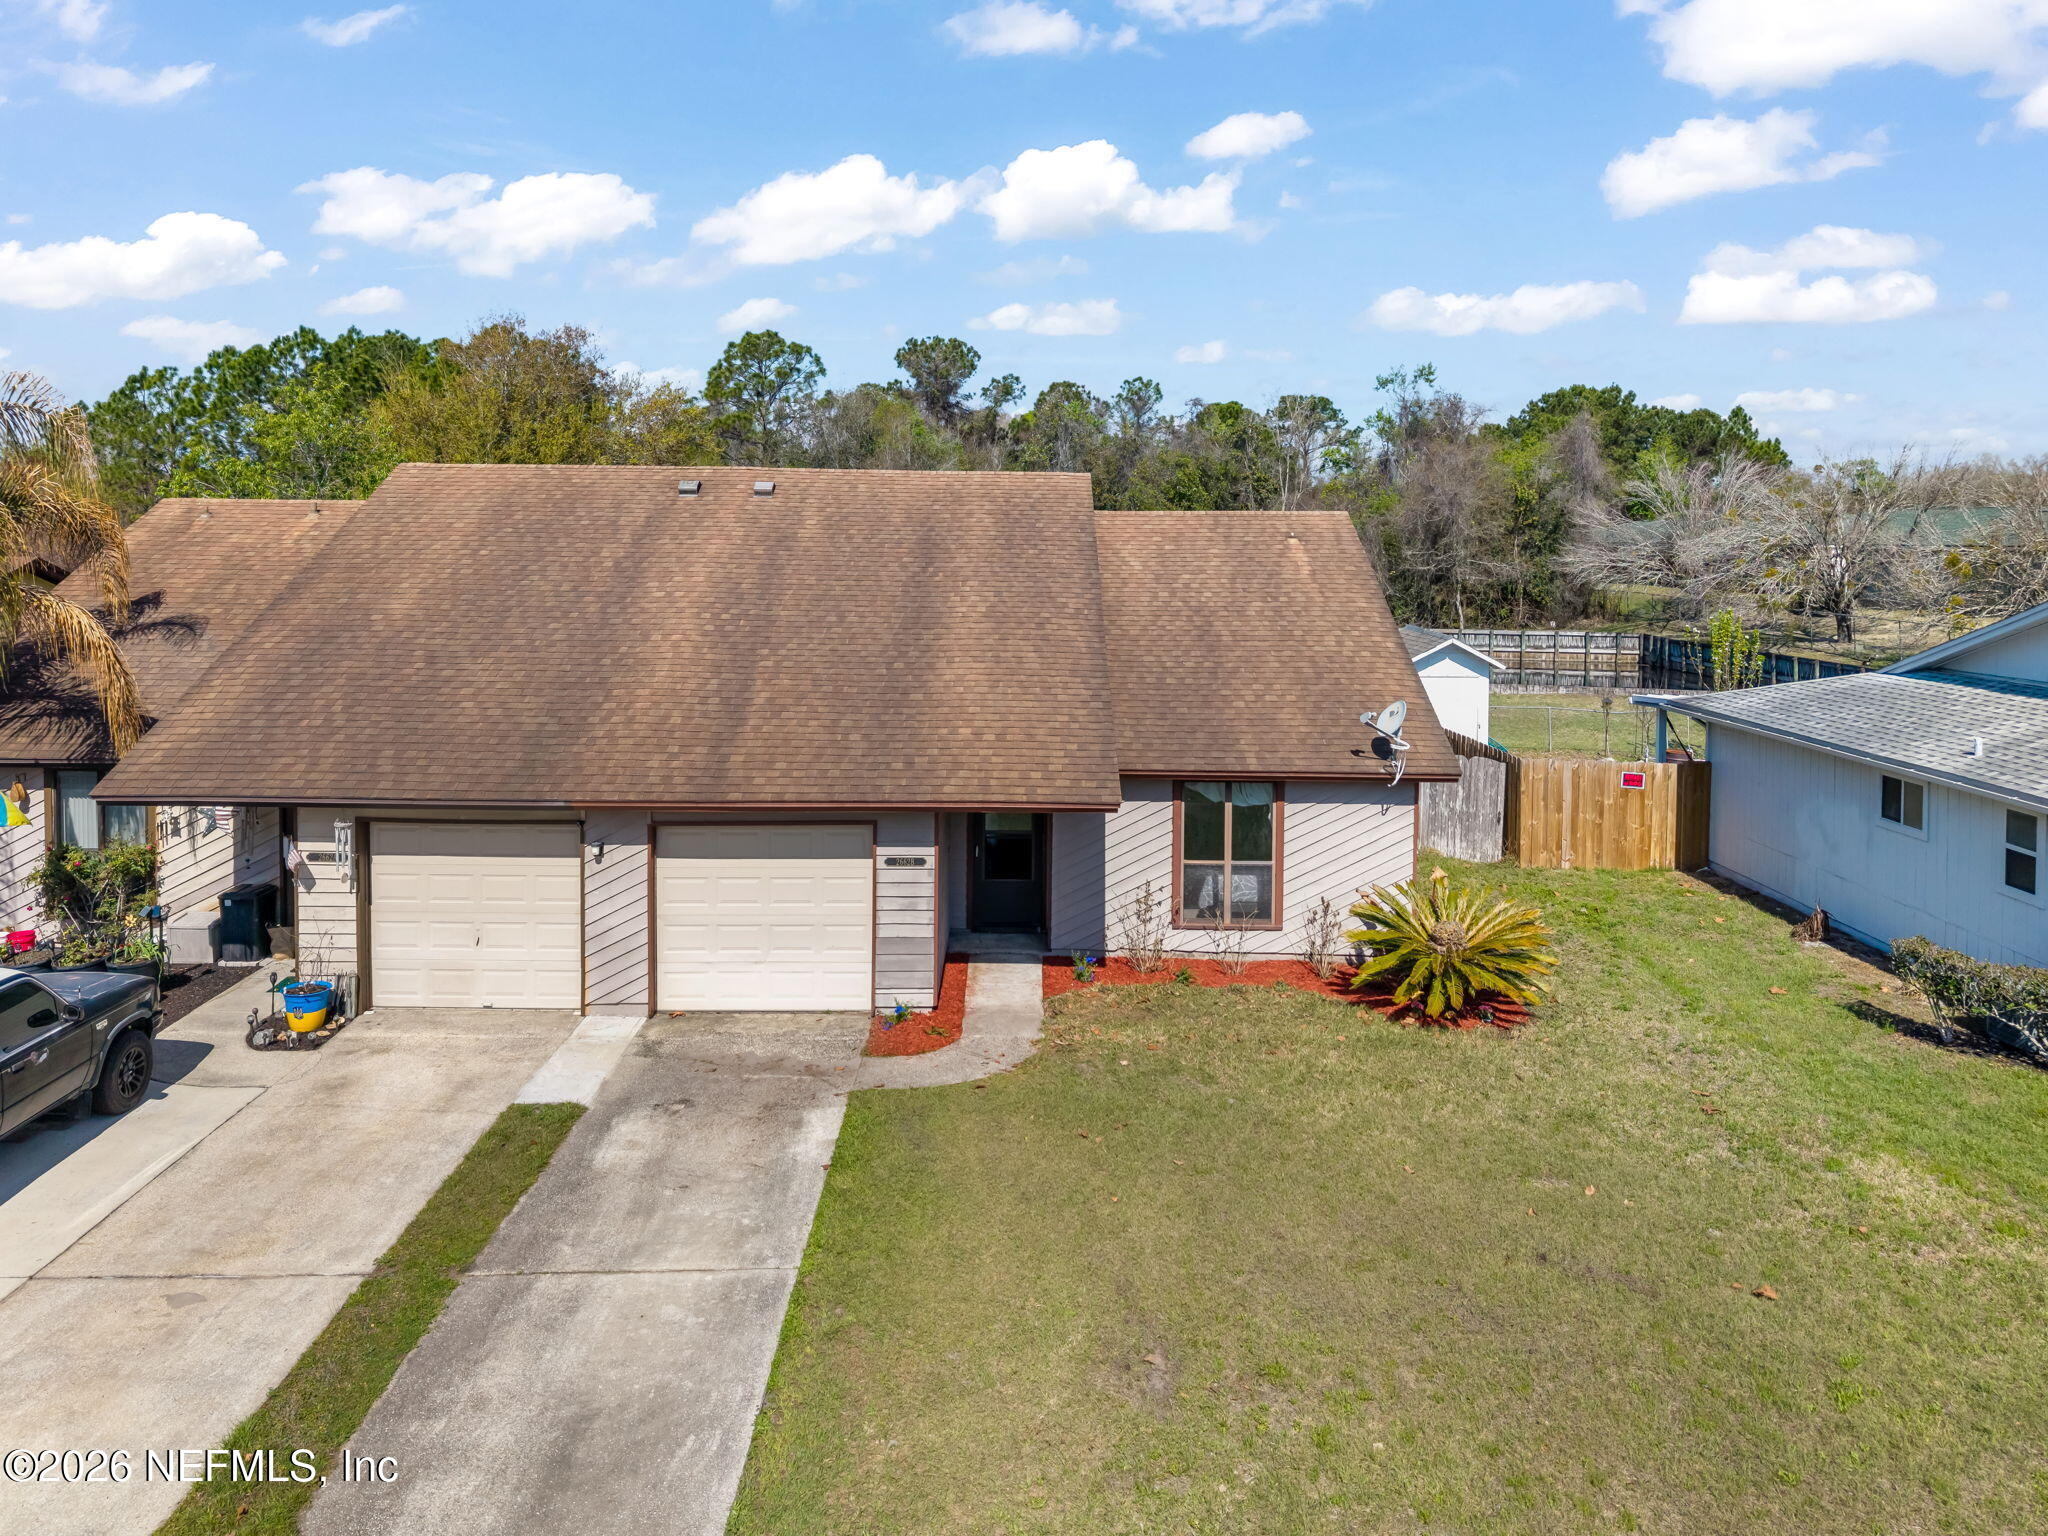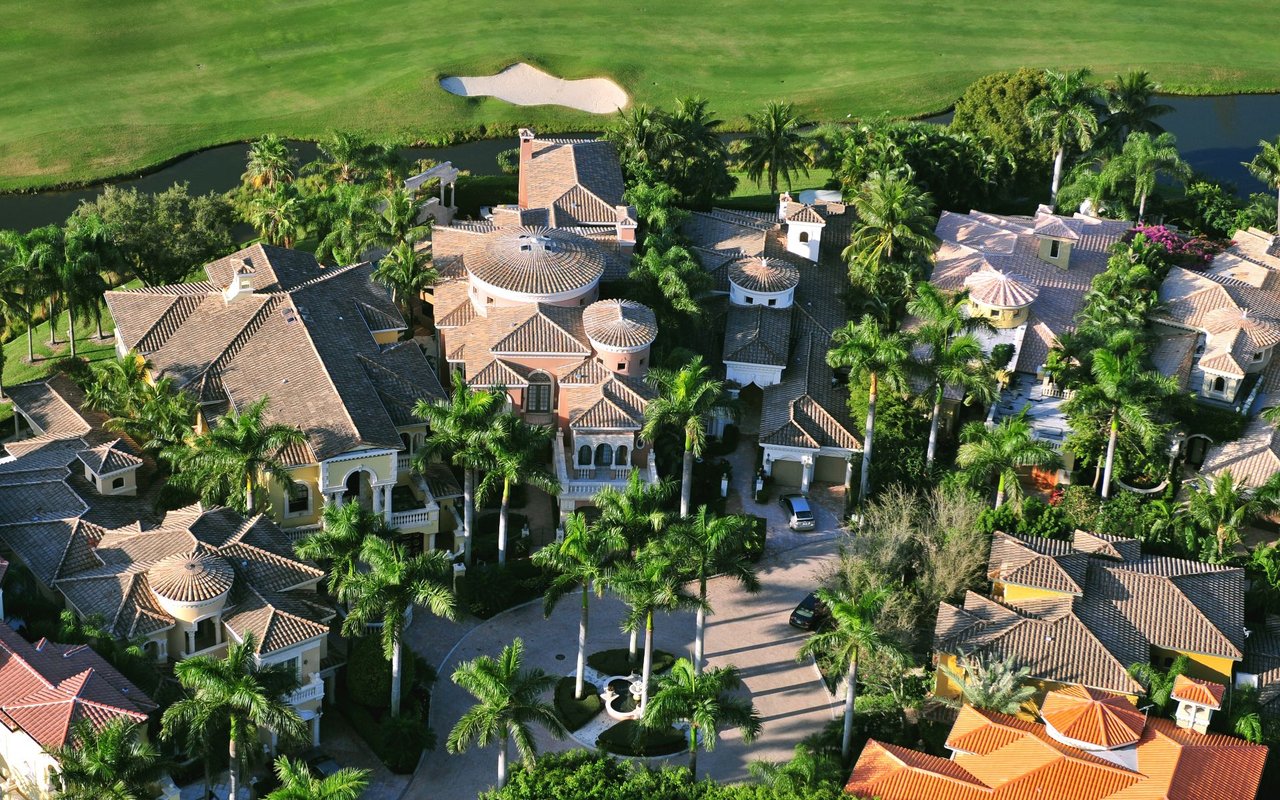
Welcome to
878 people live in The Plantation at Ponte Vedra, where the median age is 59 and the average individual income is $93,291. Data provided by the U.S. Census Bureau.
Total Population
Median Age
Population Density
Average individual Income
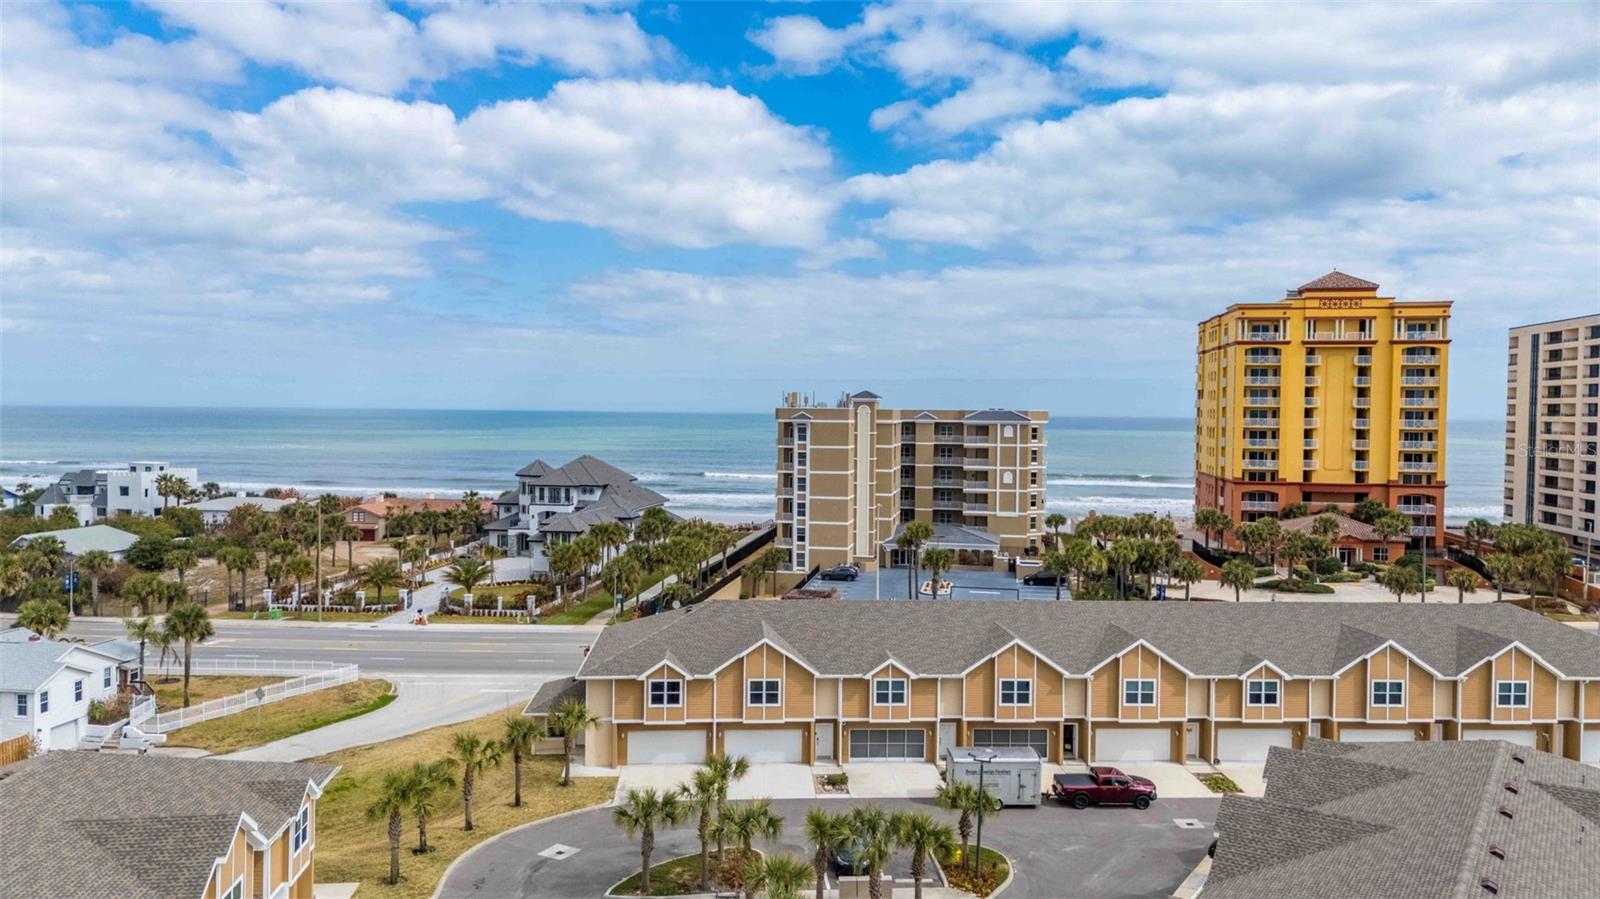
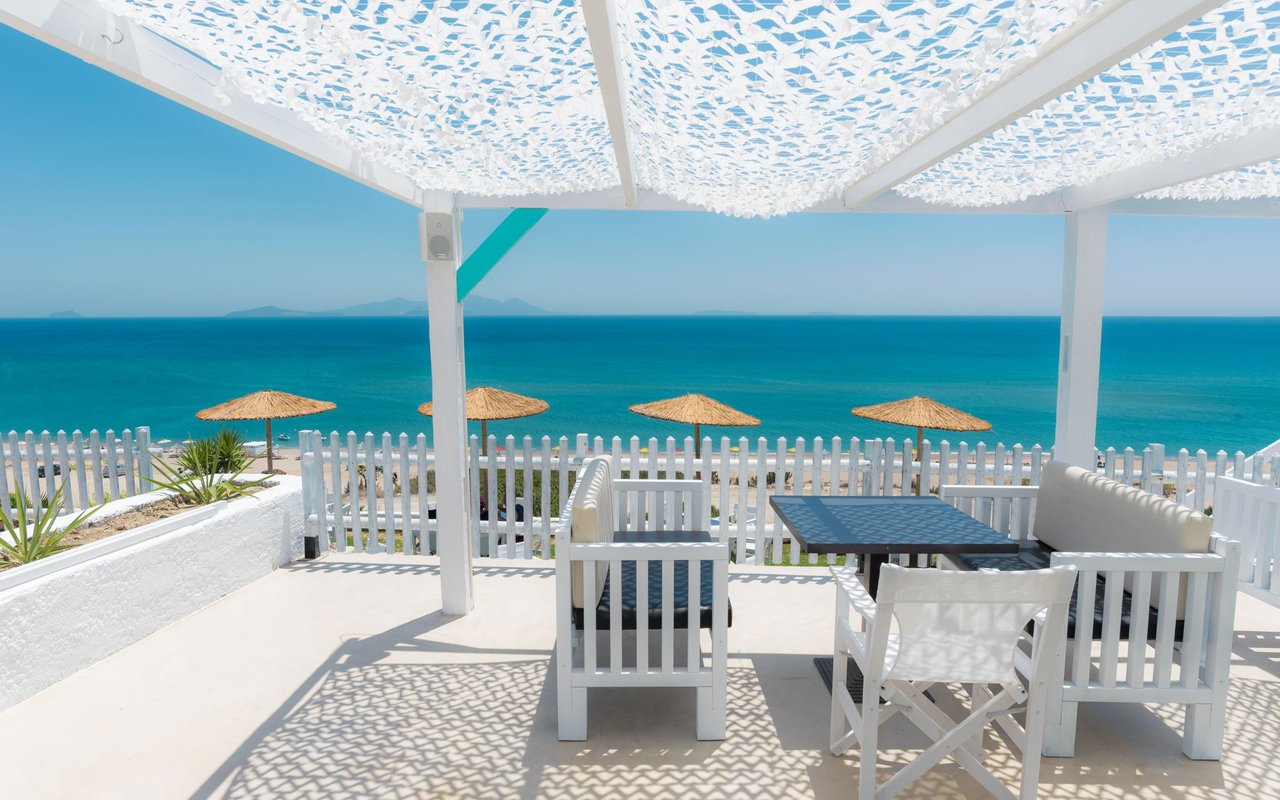
There's plenty to do around The Plantation at Ponte Vedra, including shopping, dining, nightlife, parks, and more. Data provided by Walk Score and Yelp.
Explore popular things to do in the area, including Backyard Buffalo, Salt Run BBQ, and Easy Açaí.
| Name | Category | Distance | Reviews |
Ratings by
Yelp
|
|---|---|---|---|---|
| Dining | 1.62 miles | 12 reviews | 5/5 stars | |
| Dining | 4.74 miles | 9 reviews | 5/5 stars | |
| Dining | 4.34 miles | 17 reviews | 5/5 stars | |
| Active | 3.54 miles | 8 reviews | 5/5 stars | |
| Active | 2.18 miles | 7 reviews | 5/5 stars | |
| Beauty | 4.45 miles | 6 reviews | 5/5 stars | |
|
|
||||
|
|
||||
|
|
||||
|
|
||||
|
|
||||
|
|
The Plantation at Ponte Vedra has 398 households, with an average household size of 2. Data provided by the U.S. Census Bureau. Here’s what the people living in The Plantation at Ponte Vedra do for work — and how long it takes them to get there. Data provided by the U.S. Census Bureau. 878 people call The Plantation at Ponte Vedra home. The population density is 4,458.659 and the largest age group is Data provided by the U.S. Census Bureau.
Total Population
Population Density Population Density This is the number of people per square mile in a neighborhood.
Median Age
Men vs Women
Population by Age Group
0-9 Years
10-17 Years
18-24 Years
25-64 Years
65-74 Years
75+ Years
Education Level
Total Households
Average Household Size
Average individual Income
Households with Children
With Children:
Without Children:
Blue vs White Collar Workers
Blue Collar:
White Collar:
Florida Coastal Team
O: (904) 664-9864
M: (904) 329-7895
[email protected]
Office
101 East Town Place #130
St Augustine FL 32092
Florida Coastal Team
O: (904) 664-9864
M: (904) 329-7895
[email protected]
Office
101 East Town Place #130
St Augustine FL 32092